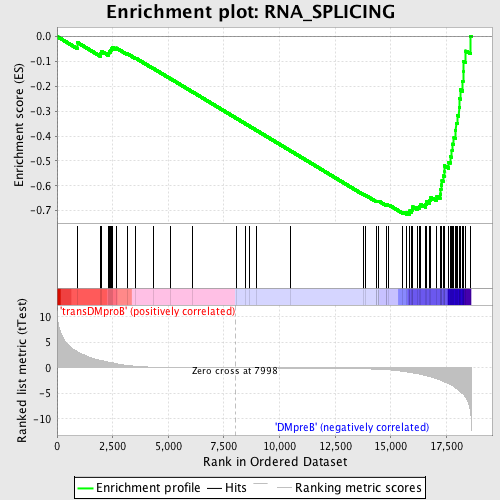
Profile of the Running ES Score & Positions of GeneSet Members on the Rank Ordered List
| Dataset | Set_04_transDMproB_versus_DMpreB.phenotype_transDMproB_versus_DMpreB.cls #transDMproB_versus_DMpreB.phenotype_transDMproB_versus_DMpreB.cls #transDMproB_versus_DMpreB_repos |
| Phenotype | phenotype_transDMproB_versus_DMpreB.cls#transDMproB_versus_DMpreB_repos |
| Upregulated in class | DMpreB |
| GeneSet | RNA_SPLICING |
| Enrichment Score (ES) | -0.7151758 |
| Normalized Enrichment Score (NES) | -1.6983037 |
| Nominal p-value | 0.0 |
| FDR q-value | 0.013809115 |
| FWER p-Value | 0.122 |
| PROBE | DESCRIPTION (from dataset) | GENE SYMBOL | GENE_TITLE | RANK IN GENE LIST | RANK METRIC SCORE | RUNNING ES | CORE ENRICHMENT | |
|---|---|---|---|---|---|---|---|---|
| 1 | PPARGC1A | 16533 | 925 | 3.119 | -0.0248 | No | ||
| 2 | ZNF638 | 9476 | 1963 | 1.448 | -0.0691 | No | ||
| 3 | SFRS5 | 9808 2062 | 1983 | 1.425 | -0.0587 | No | ||
| 4 | SRRM1 | 6958 | 2300 | 1.120 | -0.0667 | No | ||
| 5 | SF3B2 | 23974 | 2334 | 1.088 | -0.0597 | No | ||
| 6 | SFRS7 | 22889 | 2401 | 1.027 | -0.0551 | No | ||
| 7 | SFRS10 | 9818 1722 5441 | 2457 | 0.997 | -0.0500 | No | ||
| 8 | SNRPA1 | 1373 18216 | 2484 | 0.986 | -0.0435 | No | ||
| 9 | SFPQ | 12936 | 2659 | 0.820 | -0.0463 | No | ||
| 10 | SFRS8 | 10543 6089 | 3152 | 0.468 | -0.0691 | No | ||
| 11 | SYNCRIP | 3078 3035 3107 | 3530 | 0.309 | -0.0869 | No | ||
| 12 | PRPF8 | 20780 1371 | 4324 | 0.131 | -0.1286 | No | ||
| 13 | RNPS1 | 9730 23361 | 5114 | 0.062 | -0.1706 | No | ||
| 14 | SNRPN | 1715 9844 5471 | 6107 | 0.030 | -0.2238 | No | ||
| 15 | SNRPB2 | 5470 | 8074 | -0.001 | -0.3298 | No | ||
| 16 | CUGBP1 | 2805 8819 4576 2924 | 8484 | -0.007 | -0.3518 | No | ||
| 17 | DHX8 | 20649 | 8662 | -0.009 | -0.3613 | No | ||
| 18 | HNRPF | 13607 | 8972 | -0.013 | -0.3778 | No | ||
| 19 | PRPF4B | 3208 5295 | 10475 | -0.036 | -0.4585 | No | ||
| 20 | SNRPB | 9842 5469 2736 | 13755 | -0.181 | -0.6338 | No | ||
| 21 | SFRS1 | 8492 | 13847 | -0.190 | -0.6372 | No | ||
| 22 | SRPK2 | 5513 | 14351 | -0.255 | -0.6623 | No | ||
| 23 | NOL3 | 18496 915 921 | 14374 | -0.259 | -0.6614 | No | ||
| 24 | SFRS2IP | 7794 13009 | 14427 | -0.269 | -0.6620 | No | ||
| 25 | NONO | 11993 | 14460 | -0.275 | -0.6615 | No | ||
| 26 | PTBP1 | 5303 | 14798 | -0.355 | -0.6768 | No | ||
| 27 | SFRS2 | 9807 20136 | 14825 | -0.363 | -0.6753 | No | ||
| 28 | DHX16 | 23247 | 14917 | -0.388 | -0.6771 | No | ||
| 29 | PRPF31 | 7594 | 15546 | -0.677 | -0.7055 | No | ||
| 30 | SF3B4 | 22269 | 15726 | -0.807 | -0.7087 | Yes | ||
| 31 | SFRS9 | 16731 | 15840 | -0.887 | -0.7077 | Yes | ||
| 32 | CRNKL1 | 14407 | 15850 | -0.893 | -0.7010 | Yes | ||
| 33 | SNW1 | 7282 | 15941 | -0.972 | -0.6980 | Yes | ||
| 34 | IVNS1ABP | 4384 4050 | 15957 | -0.984 | -0.6909 | Yes | ||
| 35 | GEMIN6 | 12492 7415 | 15989 | -0.998 | -0.6846 | Yes | ||
| 36 | DHX38 | 48 | 16196 | -1.137 | -0.6866 | Yes | ||
| 37 | ASCC3L1 | 14867 | 16299 | -1.230 | -0.6822 | Yes | ||
| 38 | GEMIN7 | 17944 | 16349 | -1.275 | -0.6746 | Yes | ||
| 39 | SF3A1 | 7450 | 16568 | -1.527 | -0.6741 | Yes | ||
| 40 | SNRPF | 7645 | 16611 | -1.562 | -0.6638 | Yes | ||
| 41 | TXNL4A | 6567 11329 | 16753 | -1.689 | -0.6578 | Yes | ||
| 42 | SF3A3 | 16091 | 16797 | -1.744 | -0.6462 | Yes | ||
| 43 | SNRPG | 12622 | 17069 | -2.131 | -0.6436 | Yes | ||
| 44 | SIP1 | 21263 | 17216 | -2.327 | -0.6328 | Yes | ||
| 45 | PRPF3 | 12899 12898 1877 7703 | 17238 | -2.379 | -0.6149 | Yes | ||
| 46 | SNRPD3 | 12514 | 17260 | -2.426 | -0.5965 | Yes | ||
| 47 | SF3A2 | 19938 | 17297 | -2.514 | -0.5783 | Yes | ||
| 48 | DDX39 | 18551 | 17356 | -2.632 | -0.5602 | Yes | ||
| 49 | DDX20 | 15213 | 17409 | -2.718 | -0.5412 | Yes | ||
| 50 | SFRS6 | 14751 | 17415 | -2.724 | -0.5196 | Yes | ||
| 51 | PHF5A | 22194 | 17601 | -3.077 | -0.5049 | Yes | ||
| 52 | FUSIP1 | 4715 16036 | 17671 | -3.254 | -0.4825 | Yes | ||
| 53 | NCBP2 | 12643 | 17747 | -3.425 | -0.4590 | Yes | ||
| 54 | GEMIN5 | 20439 | 17765 | -3.478 | -0.4320 | Yes | ||
| 55 | SNRP70 | 1186 | 17836 | -3.659 | -0.4064 | Yes | ||
| 56 | SF3B3 | 18746 | 17915 | -3.934 | -0.3790 | Yes | ||
| 57 | U2AF1 | 8431 | 17929 | -3.980 | -0.3477 | Yes | ||
| 58 | SNRPD1 | 23622 | 17992 | -4.171 | -0.3176 | Yes | ||
| 59 | SRPK1 | 23049 | 18064 | -4.455 | -0.2856 | Yes | ||
| 60 | SNRPD2 | 8412 | 18097 | -4.591 | -0.2505 | Yes | ||
| 61 | BCAS2 | 12662 | 18131 | -4.707 | -0.2145 | Yes | ||
| 62 | DBR1 | 19341 | 18230 | -5.034 | -0.1793 | Yes | ||
| 63 | USP39 | 1116 1083 11373 | 18250 | -5.095 | -0.1394 | Yes | ||
| 64 | LSM4 | 18583 | 18257 | -5.121 | -0.0986 | Yes | ||
| 65 | EFTUD2 | 1219 20203 | 18369 | -5.754 | -0.0584 | Yes | ||
| 66 | PPAN | 19546 | 18591 | -8.924 | 0.0013 | Yes |

