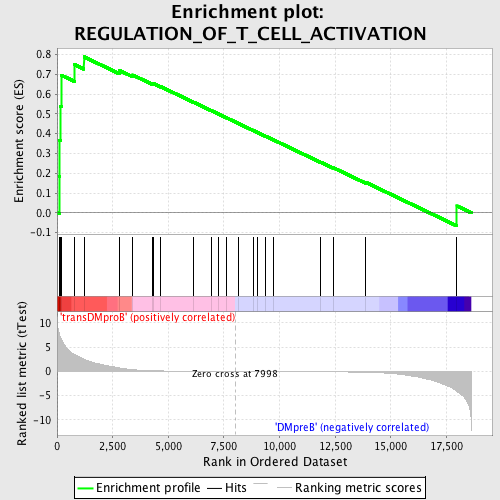
Profile of the Running ES Score & Positions of GeneSet Members on the Rank Ordered List
| Dataset | Set_04_transDMproB_versus_DMpreB.phenotype_transDMproB_versus_DMpreB.cls #transDMproB_versus_DMpreB.phenotype_transDMproB_versus_DMpreB.cls #transDMproB_versus_DMpreB_repos |
| Phenotype | phenotype_transDMproB_versus_DMpreB.cls#transDMproB_versus_DMpreB_repos |
| Upregulated in class | transDMproB |
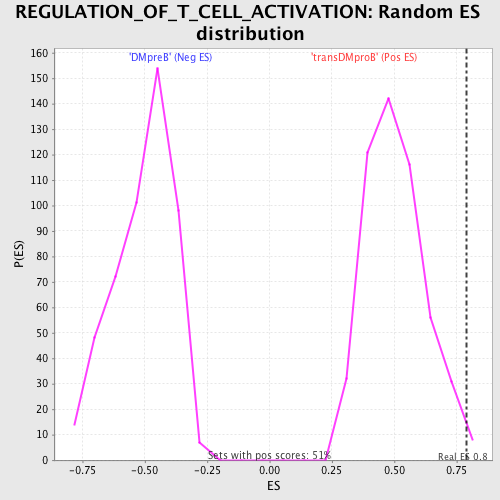
| GeneSet | REGULATION_OF_T_CELL_ACTIVATION |
| Enrichment Score (ES) | 0.7879537 |
| Normalized Enrichment Score (NES) | 1.5618229 |
| Nominal p-value | 0.009881423 |
| FDR q-value | 0.3480156 |
| FWER p-Value | 0.97 |
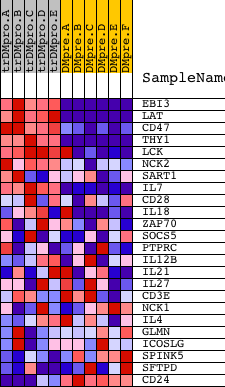
| PROBE | DESCRIPTION (from dataset) | GENE SYMBOL | GENE_TITLE | RANK IN GENE LIST | RANK METRIC SCORE | RUNNING ES | CORE ENRICHMENT | |
|---|---|---|---|---|---|---|---|---|
| 1 | EBI3 | 23193 | 103 | 7.728 | 0.1841 | Yes | ||
| 2 | LAT | 17643 | 116 | 7.434 | 0.3658 | Yes | ||
| 3 | CD47 | 4933 | 143 | 7.118 | 0.5390 | Yes | ||
| 4 | THY1 | 19481 | 201 | 6.463 | 0.6946 | Yes | ||
| 5 | LCK | 15746 | 786 | 3.491 | 0.7488 | Yes | ||
| 6 | NCK2 | 9448 | 1208 | 2.518 | 0.7880 | Yes | ||
| 7 | SART1 | 23977 | 2798 | 0.695 | 0.7196 | No | ||
| 8 | IL7 | 4921 | 3396 | 0.362 | 0.6963 | No | ||
| 9 | CD28 | 14239 4092 | 4275 | 0.138 | 0.6525 | No | ||
| 10 | IL18 | 9172 | 4353 | 0.126 | 0.6514 | No | ||
| 11 | ZAP70 | 14271 4042 | 4655 | 0.091 | 0.6375 | No | ||
| 12 | SOCS5 | 1619 23141 | 6137 | 0.030 | 0.5586 | No | ||
| 13 | PTPRC | 5327 9662 | 6953 | 0.015 | 0.5151 | No | ||
| 14 | IL12B | 20918 | 7261 | 0.010 | 0.4988 | No | ||
| 15 | IL21 | 12241 | 7600 | 0.005 | 0.4808 | No | ||
| 16 | IL27 | 17636 | 8174 | -0.003 | 0.4500 | No | ||
| 17 | CD3E | 8714 | 8819 | -0.011 | 0.4156 | No | ||
| 18 | NCK1 | 9447 5152 | 8993 | -0.014 | 0.4067 | No | ||
| 19 | IL4 | 9174 | 9385 | -0.019 | 0.3861 | No | ||
| 20 | GLMN | 16452 3562 | 9714 | -0.024 | 0.3691 | No | ||
| 21 | ICOSLG | 19973 | 11839 | -0.067 | 0.2565 | No | ||
| 22 | SPINK5 | 23569 | 12413 | -0.089 | 0.2278 | No | ||
| 23 | SFTPD | 21867 | 13860 | -0.191 | 0.1547 | No | ||
| 24 | CD24 | 8711 | 17973 | -4.116 | 0.0346 | No |