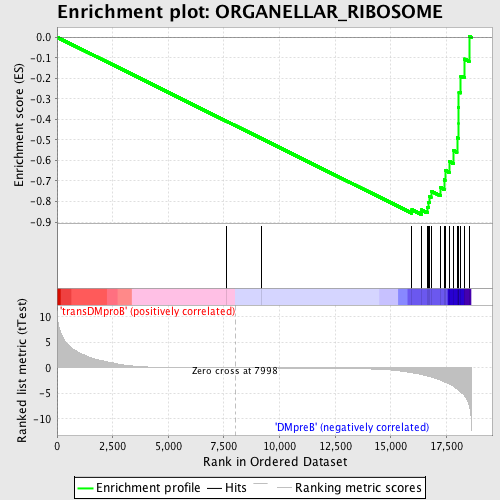
Profile of the Running ES Score & Positions of GeneSet Members on the Rank Ordered List
| Dataset | Set_04_transDMproB_versus_DMpreB.phenotype_transDMproB_versus_DMpreB.cls #transDMproB_versus_DMpreB.phenotype_transDMproB_versus_DMpreB.cls #transDMproB_versus_DMpreB_repos |
| Phenotype | phenotype_transDMproB_versus_DMpreB.cls#transDMproB_versus_DMpreB_repos |
| Upregulated in class | DMpreB |
| GeneSet | ORGANELLAR_RIBOSOME |
| Enrichment Score (ES) | -0.8630803 |
| Normalized Enrichment Score (NES) | -1.6403712 |
| Nominal p-value | 0.0018796993 |
| FDR q-value | 0.023418017 |
| FWER p-Value | 0.407 |
| PROBE | DESCRIPTION (from dataset) | GENE SYMBOL | GENE_TITLE | RANK IN GENE LIST | RANK METRIC SCORE | RUNNING ES | CORE ENRICHMENT | |
|---|---|---|---|---|---|---|---|---|
| 1 | MRPS22 | 19031 | 7628 | 0.005 | -0.4101 | No | ||
| 2 | MRPS36 | 7257 | 9202 | -0.017 | -0.4944 | No | ||
| 3 | MRPL51 | 12361 7301 | 15947 | -0.980 | -0.8402 | No | ||
| 4 | MRPS16 | 12311 | 16374 | -1.296 | -0.8408 | Yes | ||
| 5 | MRPS10 | 7229 12261 23212 | 16639 | -1.580 | -0.8278 | Yes | ||
| 6 | MRPS21 | 12323 | 16701 | -1.635 | -0.8029 | Yes | ||
| 7 | MRPS18C | 12728 | 16744 | -1.680 | -0.7763 | Yes | ||
| 8 | MRPS35 | 17237 1068 | 16809 | -1.766 | -0.7493 | Yes | ||
| 9 | MRPS11 | 12621 3150 | 17230 | -2.360 | -0.7313 | Yes | ||
| 10 | MRPL23 | 9738 | 17399 | -2.705 | -0.6938 | Yes | ||
| 11 | MRPL52 | 22019 | 17440 | -2.777 | -0.6482 | Yes | ||
| 12 | MRPS15 | 2442 12345 | 17622 | -3.113 | -0.6043 | Yes | ||
| 13 | MRPL10 | 20681 | 17825 | -3.634 | -0.5526 | Yes | ||
| 14 | MRPL55 | 20864 | 17975 | -4.120 | -0.4897 | Yes | ||
| 15 | MRPS24 | 12262 | 18047 | -4.372 | -0.4183 | Yes | ||
| 16 | MRPS28 | 15377 | 18050 | -4.384 | -0.3430 | Yes | ||
| 17 | MRPL40 | 22641 | 18062 | -4.439 | -0.2672 | Yes | ||
| 18 | MRPS12 | 17907 6273 | 18148 | -4.773 | -0.1896 | Yes | ||
| 19 | MRPS18A | 23222 | 18299 | -5.322 | -0.1061 | Yes | ||
| 20 | MRPL12 | 12090 | 18520 | -7.154 | 0.0052 | Yes |

