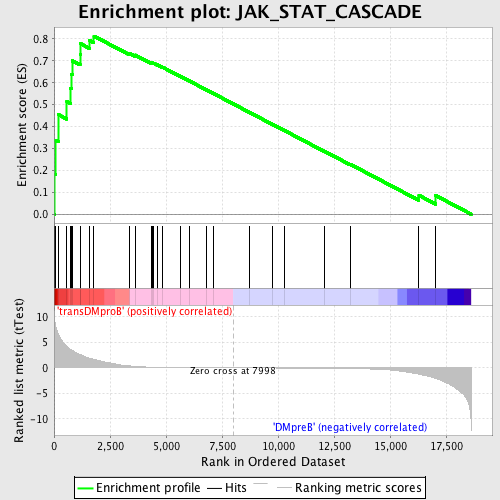
Profile of the Running ES Score & Positions of GeneSet Members on the Rank Ordered List
| Dataset | Set_04_transDMproB_versus_DMpreB.phenotype_transDMproB_versus_DMpreB.cls #transDMproB_versus_DMpreB.phenotype_transDMproB_versus_DMpreB.cls #transDMproB_versus_DMpreB_repos |
| Phenotype | phenotype_transDMproB_versus_DMpreB.cls#transDMproB_versus_DMpreB_repos |
| Upregulated in class | transDMproB |
| GeneSet | JAK_STAT_CASCADE |
| Enrichment Score (ES) | 0.81296486 |
| Normalized Enrichment Score (NES) | 1.7060014 |
| Nominal p-value | 0.0 |
| FDR q-value | 0.18632847 |
| FWER p-Value | 0.154 |
| PROBE | DESCRIPTION (from dataset) | GENE SYMBOL | GENE_TITLE | RANK IN GENE LIST | RANK METRIC SCORE | RUNNING ES | CORE ENRICHMENT | |
|---|---|---|---|---|---|---|---|---|
| 1 | STAT4 | 14251 9907 | 25 | 9.695 | 0.1820 | Yes | ||
| 2 | SOCS2 | 5694 | 65 | 8.301 | 0.3369 | Yes | ||
| 3 | STAT1 | 3936 5524 | 190 | 6.574 | 0.4546 | Yes | ||
| 4 | STAT3 | 5525 9906 | 569 | 4.247 | 0.5146 | Yes | ||
| 5 | STAT5A | 20664 | 727 | 3.634 | 0.5748 | Yes | ||
| 6 | HCLS1 | 22770 | 781 | 3.509 | 0.6383 | Yes | ||
| 7 | IL12A | 4913 | 820 | 3.377 | 0.7002 | Yes | ||
| 8 | STAT2 | 19840 | 1162 | 2.593 | 0.7309 | Yes | ||
| 9 | PIAS1 | 7126 | 1179 | 2.563 | 0.7785 | Yes | ||
| 10 | STAMBP | 17097 | 1579 | 1.887 | 0.7927 | Yes | ||
| 11 | SOCS3 | 20131 | 1779 | 1.638 | 0.8130 | Yes | ||
| 12 | IFNAR2 | 22705 1699 | 3380 | 0.366 | 0.7338 | No | ||
| 13 | F2 | 14524 | 3610 | 0.281 | 0.7268 | No | ||
| 14 | CLCF1 | 12160 3742 | 4347 | 0.127 | 0.6896 | No | ||
| 15 | NMI | 14590 | 4369 | 0.123 | 0.6908 | No | ||
| 16 | IFNAR1 | 22703 | 4428 | 0.116 | 0.6899 | No | ||
| 17 | HGS | 20568 | 4594 | 0.096 | 0.6828 | No | ||
| 18 | CCL2 | 9788 | 4849 | 0.076 | 0.6706 | No | ||
| 19 | IL20 | 13840 | 5637 | 0.042 | 0.6291 | No | ||
| 20 | NF2 | 1222 5166 | 6028 | 0.032 | 0.6087 | No | ||
| 21 | SOCS6 | 12042 7044 | 6788 | 0.017 | 0.5682 | No | ||
| 22 | LYN | 16281 | 7117 | 0.012 | 0.5508 | No | ||
| 23 | STAT5B | 20222 | 8729 | -0.010 | 0.4643 | No | ||
| 24 | CCR2 | 19250 | 9759 | -0.024 | 0.4094 | No | ||
| 25 | IL31RA | 21347 | 10276 | -0.033 | 0.3823 | No | ||
| 26 | FGFR3 | 8969 3566 | 12064 | -0.074 | 0.2875 | No | ||
| 27 | IL22RA2 | 20082 | 13229 | -0.134 | 0.2274 | No | ||
| 28 | F2R | 21386 | 16286 | -1.215 | 0.0860 | No | ||
| 29 | SOCS1 | 4522 | 17035 | -2.077 | 0.0851 | No |

