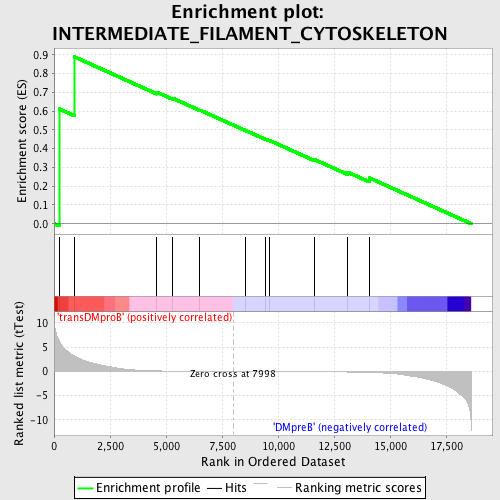
Profile of the Running ES Score & Positions of GeneSet Members on the Rank Ordered List
| Dataset | Set_04_transDMproB_versus_DMpreB.phenotype_transDMproB_versus_DMpreB.cls #transDMproB_versus_DMpreB.phenotype_transDMproB_versus_DMpreB.cls #transDMproB_versus_DMpreB_repos |
| Phenotype | phenotype_transDMproB_versus_DMpreB.cls#transDMproB_versus_DMpreB_repos |
| Upregulated in class | transDMproB |
| GeneSet | INTERMEDIATE_FILAMENT_CYTOSKELETON |
| Enrichment Score (ES) | 0.88922334 |
| Normalized Enrichment Score (NES) | 1.5251639 |
| Nominal p-value | 0.007920792 |
| FDR q-value | 0.39637312 |
| FWER p-Value | 0.997 |
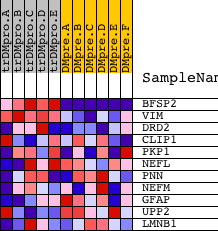
| PROBE | DESCRIPTION (from dataset) | GENE SYMBOL | GENE_TITLE | RANK IN GENE LIST | RANK METRIC SCORE | RUNNING ES | CORE ENRICHMENT | |
|---|---|---|---|---|---|---|---|---|
| 1 | BFSP2 | 8420 | 223 | 6.289 | 0.6118 | Yes | ||
| 2 | VIM | 80 | 907 | 3.168 | 0.8892 | Yes | ||
| 3 | DRD2 | 19461 | 4591 | 0.096 | 0.7008 | No | ||
| 4 | CLIP1 | 3603 7121 | 5270 | 0.056 | 0.6699 | No | ||
| 5 | PKP1 | 13821 | 6509 | 0.022 | 0.6056 | No | ||
| 6 | NEFL | 9459 | 8565 | -0.007 | 0.4959 | No | ||
| 7 | PNN | 9596 | 9439 | -0.020 | 0.4509 | No | ||
| 8 | NEFM | 5171 | 9595 | -0.022 | 0.4448 | No | ||
| 9 | GFAP | 4774 | 11641 | -0.061 | 0.3409 | No | ||
| 10 | UPP2 | 15009 13346 8032 | 13109 | -0.125 | 0.2745 | No | ||
| 11 | LMNB1 | 23549 1943 | 14078 | -0.216 | 0.2439 | No |