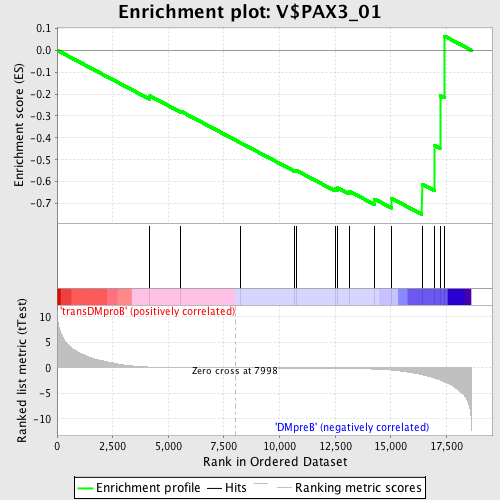
Profile of the Running ES Score & Positions of GeneSet Members on the Rank Ordered List
| Dataset | Set_04_transDMproB_versus_DMpreB.phenotype_transDMproB_versus_DMpreB.cls #transDMproB_versus_DMpreB.phenotype_transDMproB_versus_DMpreB.cls #transDMproB_versus_DMpreB_repos |
| Phenotype | phenotype_transDMproB_versus_DMpreB.cls#transDMproB_versus_DMpreB_repos |
| Upregulated in class | DMpreB |
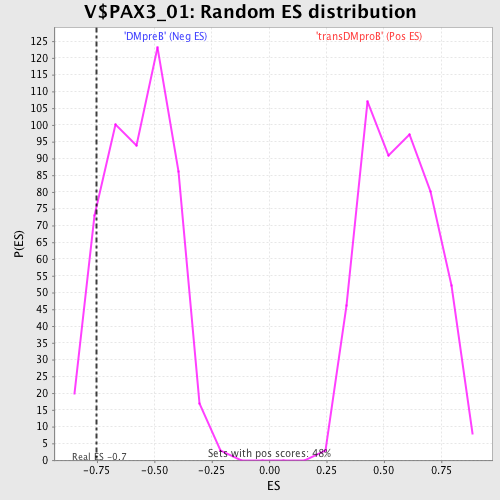
| GeneSet | V$PAX3_01 |
| Enrichment Score (ES) | -0.749929 |
| Normalized Enrichment Score (NES) | -1.3275216 |
| Nominal p-value | 0.11821705 |
| FDR q-value | 0.4515285 |
| FWER p-Value | 1.0 |
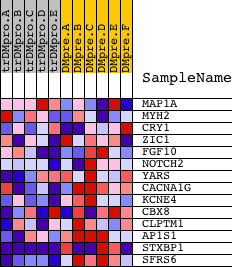
| PROBE | DESCRIPTION (from dataset) | GENE SYMBOL | GENE_TITLE | RANK IN GENE LIST | RANK METRIC SCORE | RUNNING ES | CORE ENRICHMENT | |
|---|---|---|---|---|---|---|---|---|
| 1 | MAP1A | 5124 | 4173 | 0.151 | -0.2086 | No | ||
| 2 | MYH2 | 20838 | 5553 | 0.044 | -0.2782 | No | ||
| 3 | CRY1 | 19662 | 8260 | -0.004 | -0.4232 | No | ||
| 4 | ZIC1 | 19040 | 10649 | -0.039 | -0.5475 | No | ||
| 5 | FGF10 | 4719 8962 | 10752 | -0.041 | -0.5487 | No | ||
| 6 | NOTCH2 | 15485 | 12498 | -0.093 | -0.6329 | No | ||
| 7 | YARS | 16071 | 12610 | -0.098 | -0.6287 | No | ||
| 8 | CACNA1G | 1237 940 20292 | 13123 | -0.126 | -0.6432 | No | ||
| 9 | KCNE4 | 12196 | 14270 | -0.243 | -0.6796 | Yes | ||
| 10 | CBX8 | 11401 | 15033 | -0.425 | -0.6764 | Yes | ||
| 11 | CLPTM1 | 17940 | 16401 | -1.336 | -0.6114 | Yes | ||
| 12 | AP1S1 | 3500 3453 16335 | 16979 | -1.997 | -0.4352 | Yes | ||
| 13 | STXBP1 | 2818 9930 | 17213 | -2.321 | -0.2071 | Yes | ||
| 14 | SFRS6 | 14751 | 17415 | -2.724 | 0.0646 | Yes |