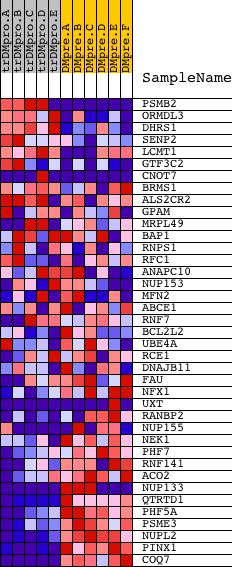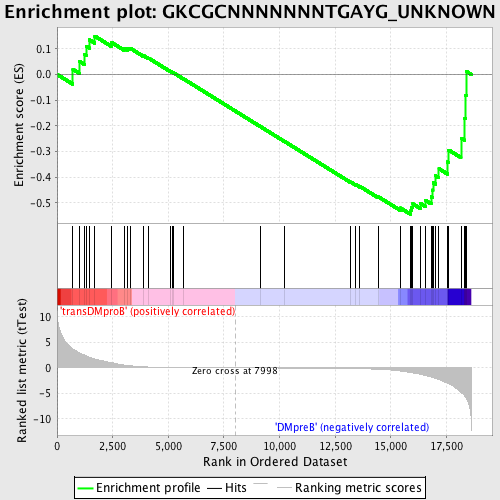
Profile of the Running ES Score & Positions of GeneSet Members on the Rank Ordered List
| Dataset | Set_04_transDMproB_versus_DMpreB.phenotype_transDMproB_versus_DMpreB.cls #transDMproB_versus_DMpreB.phenotype_transDMproB_versus_DMpreB.cls #transDMproB_versus_DMpreB_repos |
| Phenotype | phenotype_transDMproB_versus_DMpreB.cls#transDMproB_versus_DMpreB_repos |
| Upregulated in class | DMpreB |
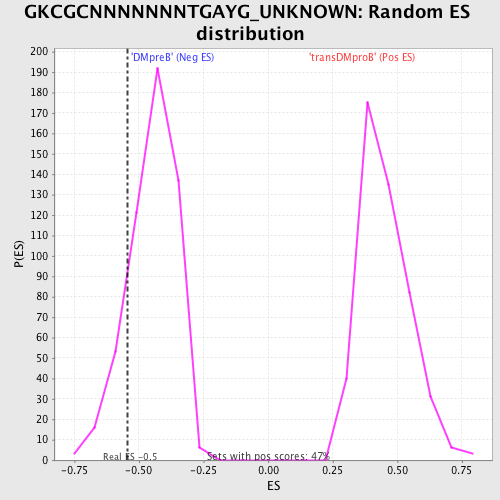
| GeneSet | GKCGCNNNNNNNTGAYG_UNKNOWN |
| Enrichment Score (ES) | -0.54519135 |
| Normalized Enrichment Score (NES) | -1.2176085 |
| Nominal p-value | 0.14015152 |
| FDR q-value | 0.7310743 |
| FWER p-Value | 1.0 |
| PROBE | DESCRIPTION (from dataset) | GENE SYMBOL | GENE_TITLE | RANK IN GENE LIST | RANK METRIC SCORE | RUNNING ES | CORE ENRICHMENT | |
|---|---|---|---|---|---|---|---|---|
| 1 | PSMB2 | 2324 16078 | 711 | 3.670 | 0.0199 | No | ||
| 2 | ORMDL3 | 12386 | 1001 | 2.936 | 0.0509 | No | ||
| 3 | DHRS1 | 21819 | 1240 | 2.443 | 0.0768 | No | ||
| 4 | SENP2 | 7990 | 1310 | 2.305 | 0.1097 | No | ||
| 5 | LCMT1 | 18088 1094 | 1455 | 2.057 | 0.1345 | No | ||
| 6 | GTF3C2 | 7749 | 1695 | 1.732 | 0.1491 | No | ||
| 7 | CNOT7 | 3787 9600 | 2454 | 0.998 | 0.1241 | No | ||
| 8 | BRMS1 | 8403 | 3013 | 0.549 | 0.1028 | No | ||
| 9 | ALS2CR2 | 5966 969 | 3182 | 0.457 | 0.1010 | No | ||
| 10 | GPAM | 4795 | 3289 | 0.408 | 0.1018 | No | ||
| 11 | MRPL49 | 3696 9472 23990 | 3885 | 0.211 | 0.0731 | No | ||
| 12 | BAP1 | 22057 | 4112 | 0.162 | 0.0635 | No | ||
| 13 | RNPS1 | 9730 23361 | 5114 | 0.062 | 0.0106 | No | ||
| 14 | RFC1 | 16527 | 5202 | 0.058 | 0.0069 | No | ||
| 15 | ANAPC10 | 7595 12760 7596 | 5217 | 0.058 | 0.0070 | No | ||
| 16 | NUP153 | 21474 | 5681 | 0.041 | -0.0173 | No | ||
| 17 | MFN2 | 15678 2417 | 9149 | -0.016 | -0.2036 | No | ||
| 18 | ABCE1 | 6270 | 10226 | -0.032 | -0.2610 | No | ||
| 19 | RNF7 | 19036 | 13192 | -0.131 | -0.4185 | No | ||
| 20 | BCL2L2 | 8653 4441 | 13423 | -0.148 | -0.4286 | No | ||
| 21 | UBE4A | 4704 | 13610 | -0.166 | -0.4360 | No | ||
| 22 | RCE1 | 23965 | 14448 | -0.272 | -0.4767 | No | ||
| 23 | DNAJB11 | 22813 | 15428 | -0.609 | -0.5197 | No | ||
| 24 | FAU | 8954 | 15902 | -0.940 | -0.5303 | Yes | ||
| 25 | NFX1 | 2475 | 15926 | -0.961 | -0.5163 | Yes | ||
| 26 | UXT | 5837 10267 | 15988 | -0.997 | -0.5038 | Yes | ||
| 27 | RANBP2 | 20019 | 16336 | -1.259 | -0.5025 | Yes | ||
| 28 | NUP155 | 2298 5027 | 16563 | -1.521 | -0.4905 | Yes | ||
| 29 | NEK1 | 18610 | 16815 | -1.772 | -0.4759 | Yes | ||
| 30 | PHF7 | 21890 | 16880 | -1.861 | -0.4499 | Yes | ||
| 31 | RNF141 | 12478 7392 | 16896 | -1.881 | -0.4208 | Yes | ||
| 32 | ACO2 | 8527 | 17017 | -2.055 | -0.3947 | Yes | ||
| 33 | NUP133 | 3849 18714 | 17164 | -2.237 | -0.3671 | Yes | ||
| 34 | QTRTD1 | 22590 | 17555 | -2.998 | -0.3406 | Yes | ||
| 35 | PHF5A | 22194 | 17601 | -3.077 | -0.2942 | Yes | ||
| 36 | PSME3 | 20657 | 18155 | -4.800 | -0.2479 | Yes | ||
| 37 | NUPL2 | 6072 | 18324 | -5.505 | -0.1697 | Yes | ||
| 38 | PINX1 | 21986 | 18359 | -5.704 | -0.0811 | Yes | ||
| 39 | COQ7 | 17664 | 18396 | -5.983 | 0.0118 | Yes |