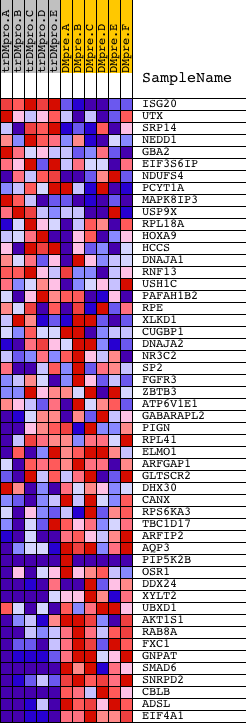
Profile of the Running ES Score & Positions of GeneSet Members on the Rank Ordered List
| Dataset | Set_04_transDMproB_versus_DMpreB.phenotype_transDMproB_versus_DMpreB.cls #transDMproB_versus_DMpreB.phenotype_transDMproB_versus_DMpreB.cls #transDMproB_versus_DMpreB_repos |
| Phenotype | phenotype_transDMproB_versus_DMpreB.cls#transDMproB_versus_DMpreB_repos |
| Upregulated in class | DMpreB |
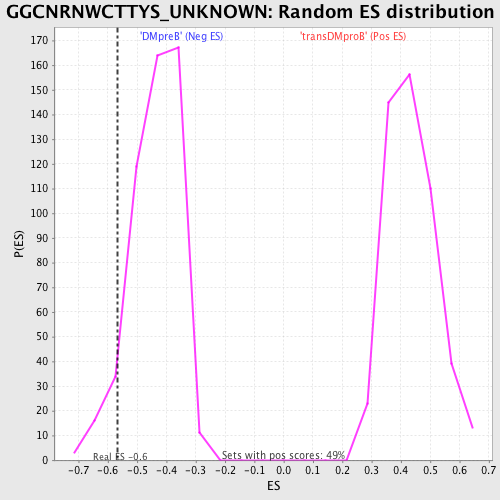
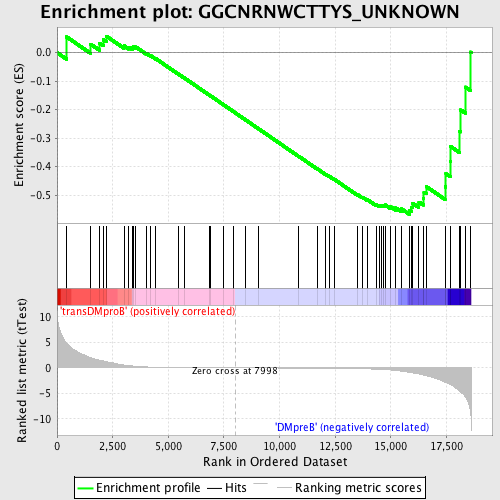
| GeneSet | GGCNRNWCTTYS_UNKNOWN |
| Enrichment Score (ES) | -0.56779253 |
| Normalized Enrichment Score (NES) | -1.3005633 |
| Nominal p-value | 0.06809338 |
| FDR q-value | 0.48907557 |
| FWER p-Value | 1.0 |
| PROBE | DESCRIPTION (from dataset) | GENE SYMBOL | GENE_TITLE | RANK IN GENE LIST | RANK METRIC SCORE | RUNNING ES | CORE ENRICHMENT | |
|---|---|---|---|---|---|---|---|---|
| 1 | ISG20 | 18210 | 428 | 4.803 | 0.0553 | No | ||
| 2 | UTX | 10266 2574 | 1503 | 1.992 | 0.0299 | No | ||
| 3 | SRP14 | 9894 | 1901 | 1.516 | 0.0333 | No | ||
| 4 | NEDD1 | 19643 | 2081 | 1.330 | 0.0453 | No | ||
| 5 | GBA2 | 15898 | 2212 | 1.205 | 0.0580 | No | ||
| 6 | EIF3S6IP | 22427 2301 | 3008 | 0.551 | 0.0241 | No | ||
| 7 | NDUFS4 | 9452 5157 3173 | 3225 | 0.439 | 0.0197 | No | ||
| 8 | PCYT1A | 4572 | 3387 | 0.364 | 0.0169 | No | ||
| 9 | MAPK8IP3 | 11402 23080 | 3412 | 0.354 | 0.0214 | No | ||
| 10 | USP9X | 10264 10265 5834 | 3529 | 0.310 | 0.0202 | No | ||
| 11 | RPL18A | 13358 | 4002 | 0.181 | -0.0022 | No | ||
| 12 | HOXA9 | 17147 9109 1024 | 4188 | 0.149 | -0.0098 | No | ||
| 13 | HCCS | 9079 4842 | 4443 | 0.114 | -0.0216 | No | ||
| 14 | DNAJA1 | 4878 16242 2345 | 5445 | 0.048 | -0.0747 | No | ||
| 15 | RNF13 | 6271 | 5705 | 0.040 | -0.0880 | No | ||
| 16 | USH1C | 1471 17821 | 6871 | 0.016 | -0.1505 | No | ||
| 17 | PAFAH1B2 | 5221 9525 | 6892 | 0.015 | -0.1513 | No | ||
| 18 | RPE | 14232 | 7463 | 0.007 | -0.1819 | No | ||
| 19 | XLKD1 | 17675 | 7929 | 0.001 | -0.2070 | No | ||
| 20 | CUGBP1 | 2805 8819 4576 2924 | 8484 | -0.007 | -0.2367 | No | ||
| 21 | DNAJA2 | 12133 18806 | 9035 | -0.014 | -0.2661 | No | ||
| 22 | NR3C2 | 18562 13798 | 10851 | -0.043 | -0.3631 | No | ||
| 23 | SP2 | 8130 | 11684 | -0.062 | -0.4069 | No | ||
| 24 | FGFR3 | 8969 3566 | 12064 | -0.074 | -0.4261 | No | ||
| 25 | ZBTB3 | 23941 | 12249 | -0.081 | -0.4347 | No | ||
| 26 | ATP6V1E1 | 4423 | 12449 | -0.091 | -0.4440 | No | ||
| 27 | GABARAPL2 | 8211 13552 | 13523 | -0.158 | -0.4992 | No | ||
| 28 | PIGN | 13865 | 13717 | -0.176 | -0.5067 | No | ||
| 29 | RPL41 | 12611 | 13947 | -0.199 | -0.5158 | No | ||
| 30 | ELMO1 | 3275 8939 3202 3271 3254 3235 3164 3175 3274 3188 3293 3214 3218 3239 | 14344 | -0.253 | -0.5330 | No | ||
| 31 | ARFGAP1 | 14705 2854 | 14482 | -0.279 | -0.5358 | No | ||
| 32 | GLTSCR2 | 12639 | 14576 | -0.301 | -0.5359 | No | ||
| 33 | DHX30 | 18989 | 14660 | -0.320 | -0.5352 | No | ||
| 34 | CANX | 4474 | 14747 | -0.345 | -0.5342 | No | ||
| 35 | RPS6KA3 | 8490 | 14980 | -0.408 | -0.5400 | No | ||
| 36 | TBC1D17 | 6121 | 15220 | -0.501 | -0.5447 | No | ||
| 37 | ARFIP2 | 1226 17702 | 15477 | -0.642 | -0.5480 | No | ||
| 38 | AQP3 | 15915 | 15845 | -0.891 | -0.5533 | Yes | ||
| 39 | PIP5K2B | 20269 1254 | 15936 | -0.968 | -0.5423 | Yes | ||
| 40 | OSR1 | 18971 | 15977 | -0.994 | -0.5283 | Yes | ||
| 41 | DDX24 | 2084 20995 | 16262 | -1.194 | -0.5241 | Yes | ||
| 42 | XYLT2 | 20288 | 16461 | -1.417 | -0.5116 | Yes | ||
| 43 | UBXD1 | 12370 1516 | 16489 | -1.447 | -0.4895 | Yes | ||
| 44 | AKT1S1 | 12557 | 16605 | -1.556 | -0.4703 | Yes | ||
| 45 | RAB8A | 9380 5091 | 17442 | -2.781 | -0.4700 | Yes | ||
| 46 | FXC1 | 8988 4043 | 17475 | -2.855 | -0.4251 | Yes | ||
| 47 | GNPAT | 18420 | 17680 | -3.286 | -0.3825 | Yes | ||
| 48 | SMAD6 | 19083 | 17692 | -3.306 | -0.3292 | Yes | ||
| 49 | SNRPD2 | 8412 | 18097 | -4.591 | -0.2761 | Yes | ||
| 50 | CBLB | 5531 22734 | 18142 | -4.749 | -0.2010 | Yes | ||
| 51 | ADSL | 4358 | 18353 | -5.627 | -0.1205 | Yes | ||
| 52 | EIF4A1 | 8889 23719 | 18573 | -8.251 | 0.0023 | Yes |