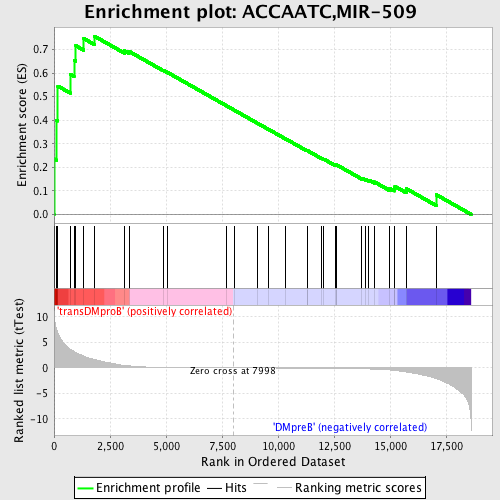
Profile of the Running ES Score & Positions of GeneSet Members on the Rank Ordered List
| Dataset | Set_04_transDMproB_versus_DMpreB.phenotype_transDMproB_versus_DMpreB.cls #transDMproB_versus_DMpreB.phenotype_transDMproB_versus_DMpreB.cls #transDMproB_versus_DMpreB_repos |
| Phenotype | phenotype_transDMproB_versus_DMpreB.cls#transDMproB_versus_DMpreB_repos |
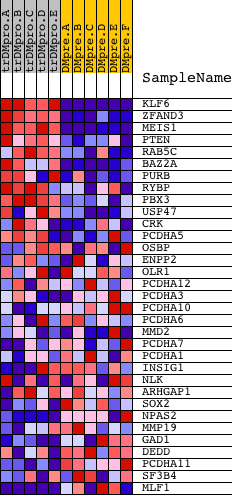
| Upregulated in class | transDMproB |
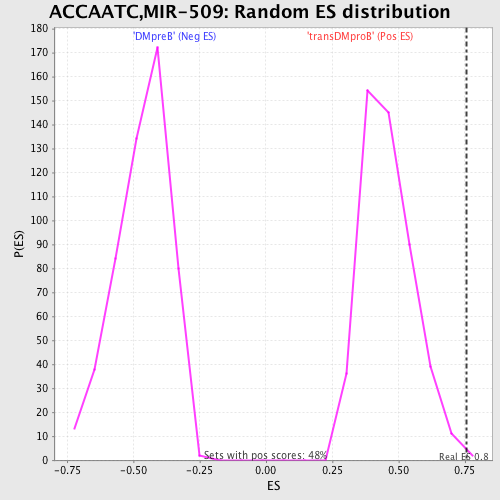
| GeneSet | ACCAATC,MIR-509 |
| Enrichment Score (ES) | 0.75661504 |
| Normalized Enrichment Score (NES) | 1.6466959 |
| Nominal p-value | 0.002096436 |
| FDR q-value | 0.032095857 |
| FWER p-Value | 0.15 |
| PROBE | DESCRIPTION (from dataset) | GENE SYMBOL | GENE_TITLE | RANK IN GENE LIST | RANK METRIC SCORE | RUNNING ES | CORE ENRICHMENT | |
|---|---|---|---|---|---|---|---|---|
| 1 | KLF6 | 10713 21711 | 5 | 10.825 | 0.2352 | Yes | ||
| 2 | ZFAND3 | 23306 | 97 | 7.798 | 0.4000 | Yes | ||
| 3 | MEIS1 | 20524 | 167 | 6.817 | 0.5446 | Yes | ||
| 4 | PTEN | 5305 | 722 | 3.641 | 0.5940 | Yes | ||
| 5 | RAB5C | 20226 | 892 | 3.201 | 0.6545 | Yes | ||
| 6 | BAZ2A | 4371 | 969 | 3.004 | 0.7158 | Yes | ||
| 7 | PURB | 5335 | 1325 | 2.278 | 0.7463 | Yes | ||
| 8 | RYBP | 17056 | 1794 | 1.633 | 0.7566 | Yes | ||
| 9 | PBX3 | 9531 2714 2705 | 3147 | 0.471 | 0.6941 | No | ||
| 10 | USP47 | 6794 | 3343 | 0.383 | 0.6919 | No | ||
| 11 | CRK | 4559 1249 | 4878 | 0.075 | 0.6110 | No | ||
| 12 | PCDHA5 | 8790 | 5082 | 0.064 | 0.6015 | No | ||
| 13 | OSBP | 4278 | 7691 | 0.004 | 0.4612 | No | ||
| 14 | ENPP2 | 9548 | 8049 | -0.001 | 0.4420 | No | ||
| 15 | OLR1 | 8427 4233 | 9062 | -0.015 | 0.3879 | No | ||
| 16 | PCDHA12 | 9645 | 9562 | -0.022 | 0.3615 | No | ||
| 17 | PCDHA3 | 9644 | 10346 | -0.035 | 0.3202 | No | ||
| 18 | PCDHA10 | 8792 | 11293 | -0.053 | 0.2704 | No | ||
| 19 | PCDHA6 | 2038 8788 | 11314 | -0.053 | 0.2705 | No | ||
| 20 | MMD2 | 16309 | 11922 | -0.070 | 0.2393 | No | ||
| 21 | PCDHA7 | 8789 | 12038 | -0.074 | 0.2347 | No | ||
| 22 | PCDHA1 | 8571 4368 | 12582 | -0.097 | 0.2076 | No | ||
| 23 | INSIG1 | 6073 10525 10526 | 12586 | -0.097 | 0.2096 | No | ||
| 24 | NLK | 5179 5178 | 12596 | -0.097 | 0.2112 | No | ||
| 25 | ARHGAP1 | 6001 10448 | 13740 | -0.179 | 0.1536 | No | ||
| 26 | SOX2 | 9849 15612 | 13901 | -0.195 | 0.1492 | No | ||
| 27 | NPAS2 | 5186 | 14046 | -0.211 | 0.1461 | No | ||
| 28 | MMP19 | 7191 | 14301 | -0.247 | 0.1378 | No | ||
| 29 | GAD1 | 14993 2690 | 14959 | -0.403 | 0.1112 | No | ||
| 30 | DEDD | 14056 | 15180 | -0.485 | 0.1099 | No | ||
| 31 | PCDHA11 | 8791 | 15213 | -0.499 | 0.1190 | No | ||
| 32 | SF3B4 | 22269 | 15726 | -0.807 | 0.1090 | No | ||
| 33 | MLF1 | 15573 | 17070 | -2.133 | 0.0832 | No |