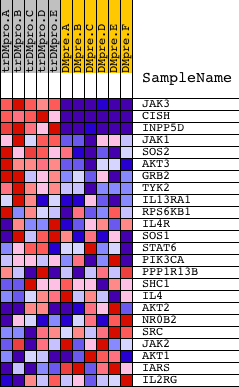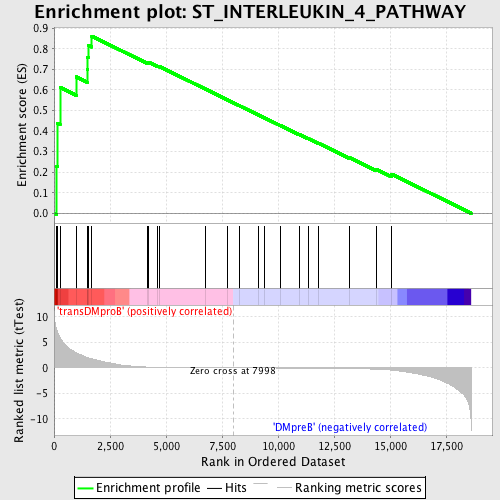
Profile of the Running ES Score & Positions of GeneSet Members on the Rank Ordered List
| Dataset | Set_04_transDMproB_versus_DMpreB.phenotype_transDMproB_versus_DMpreB.cls #transDMproB_versus_DMpreB.phenotype_transDMproB_versus_DMpreB.cls #transDMproB_versus_DMpreB_repos |
| Phenotype | phenotype_transDMproB_versus_DMpreB.cls#transDMproB_versus_DMpreB_repos |
| Upregulated in class | transDMproB |
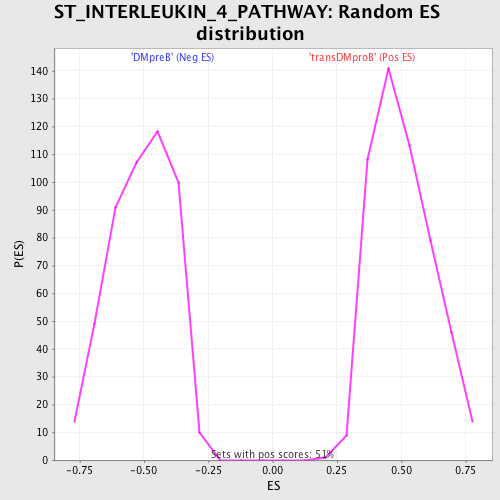
| GeneSet | ST_INTERLEUKIN_4_PATHWAY |
| Enrichment Score (ES) | 0.86216974 |
| Normalized Enrichment Score (NES) | 1.716357 |
| Nominal p-value | 0.0 |
| FDR q-value | 0.037965115 |
| FWER p-Value | 0.053 |
| PROBE | DESCRIPTION (from dataset) | GENE SYMBOL | GENE_TITLE | RANK IN GENE LIST | RANK METRIC SCORE | RUNNING ES | CORE ENRICHMENT | |
|---|---|---|---|---|---|---|---|---|
| 1 | JAK3 | 9198 4936 | 107 | 7.705 | 0.2292 | Yes | ||
| 2 | CISH | 8743 | 157 | 6.972 | 0.4392 | Yes | ||
| 3 | INPP5D | 14198 | 268 | 5.888 | 0.6128 | Yes | ||
| 4 | JAK1 | 15827 | 996 | 2.955 | 0.6638 | Yes | ||
| 5 | SOS2 | 21049 | 1479 | 2.025 | 0.6997 | Yes | ||
| 6 | AKT3 | 13739 982 | 1498 | 1.998 | 0.7596 | Yes | ||
| 7 | GRB2 | 20149 | 1534 | 1.943 | 0.8170 | Yes | ||
| 8 | TYK2 | 12058 19215 | 1683 | 1.742 | 0.8622 | Yes | ||
| 9 | IL13RA1 | 24361 | 4158 | 0.153 | 0.7338 | No | ||
| 10 | RPS6KB1 | 7815 1207 13040 | 4207 | 0.147 | 0.7357 | No | ||
| 11 | IL4R | 18085 | 4633 | 0.093 | 0.7156 | No | ||
| 12 | SOS1 | 5476 | 4708 | 0.086 | 0.7143 | No | ||
| 13 | STAT6 | 19854 9909 | 6760 | 0.018 | 0.6045 | No | ||
| 14 | PIK3CA | 9562 | 7760 | 0.003 | 0.5509 | No | ||
| 15 | PPP1R13B | 10211 20980 | 8294 | -0.004 | 0.5223 | No | ||
| 16 | SHC1 | 9813 9812 5430 | 9137 | -0.016 | 0.4775 | No | ||
| 17 | IL4 | 9174 | 9385 | -0.019 | 0.4648 | No | ||
| 18 | AKT2 | 4365 4366 | 10089 | -0.030 | 0.4279 | No | ||
| 19 | NR0B2 | 16050 | 10939 | -0.045 | 0.3836 | No | ||
| 20 | SRC | 5507 | 11343 | -0.054 | 0.3636 | No | ||
| 21 | JAK2 | 23893 9197 3706 | 11817 | -0.066 | 0.3402 | No | ||
| 22 | AKT1 | 8568 | 13190 | -0.131 | 0.2704 | No | ||
| 23 | IARS | 4190 8361 8362 | 14370 | -0.258 | 0.2148 | No | ||
| 24 | IL2RG | 24096 | 15069 | -0.442 | 0.1908 | No |