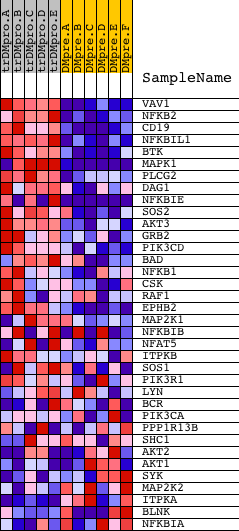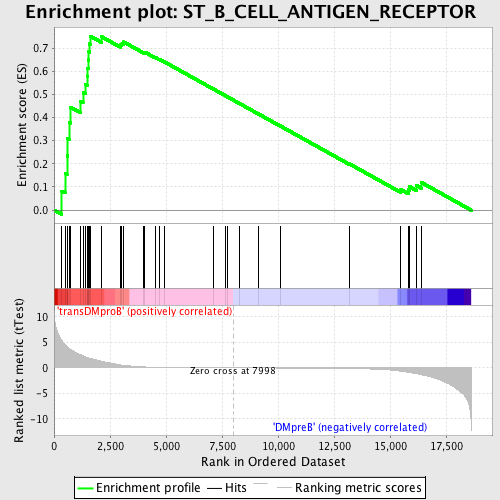
Profile of the Running ES Score & Positions of GeneSet Members on the Rank Ordered List
| Dataset | Set_04_transDMproB_versus_DMpreB.phenotype_transDMproB_versus_DMpreB.cls #transDMproB_versus_DMpreB.phenotype_transDMproB_versus_DMpreB.cls #transDMproB_versus_DMpreB_repos |
| Phenotype | phenotype_transDMproB_versus_DMpreB.cls#transDMproB_versus_DMpreB_repos |
| Upregulated in class | transDMproB |
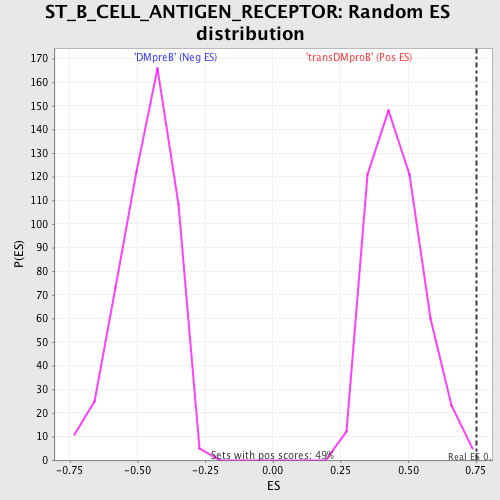
| GeneSet | ST_B_CELL_ANTIGEN_RECEPTOR |
| Enrichment Score (ES) | 0.75129837 |
| Normalized Enrichment Score (NES) | 1.6471583 |
| Nominal p-value | 0.0020408162 |
| FDR q-value | 0.10427061 |
| FWER p-Value | 0.265 |
| PROBE | DESCRIPTION (from dataset) | GENE SYMBOL | GENE_TITLE | RANK IN GENE LIST | RANK METRIC SCORE | RUNNING ES | CORE ENRICHMENT | |
|---|---|---|---|---|---|---|---|---|
| 1 | VAV1 | 23173 | 347 | 5.300 | 0.0819 | Yes | ||
| 2 | NFKB2 | 23810 | 491 | 4.513 | 0.1598 | Yes | ||
| 3 | CD19 | 17640 | 580 | 4.195 | 0.2347 | Yes | ||
| 4 | NFKBIL1 | 23002 | 606 | 4.048 | 0.3101 | Yes | ||
| 5 | BTK | 24061 | 669 | 3.794 | 0.3788 | Yes | ||
| 6 | MAPK1 | 1642 11167 | 721 | 3.643 | 0.4451 | Yes | ||
| 7 | PLCG2 | 18453 | 1181 | 2.559 | 0.4690 | Yes | ||
| 8 | DAG1 | 18996 8837 | 1293 | 2.333 | 0.5073 | Yes | ||
| 9 | NFKBIE | 23225 1556 | 1402 | 2.139 | 0.5420 | Yes | ||
| 10 | SOS2 | 21049 | 1479 | 2.025 | 0.5764 | Yes | ||
| 11 | AKT3 | 13739 982 | 1498 | 1.998 | 0.6133 | Yes | ||
| 12 | GRB2 | 20149 | 1534 | 1.943 | 0.6483 | Yes | ||
| 13 | PIK3CD | 9563 | 1550 | 1.916 | 0.6838 | Yes | ||
| 14 | BAD | 24000 | 1588 | 1.876 | 0.7174 | Yes | ||
| 15 | NFKB1 | 15160 | 1611 | 1.847 | 0.7513 | Yes | ||
| 16 | CSK | 8805 | 2115 | 1.299 | 0.7489 | No | ||
| 17 | RAF1 | 17035 | 2978 | 0.564 | 0.7132 | No | ||
| 18 | EPHB2 | 4675 2440 8910 | 3029 | 0.541 | 0.7208 | No | ||
| 19 | MAP2K1 | 19082 | 3106 | 0.498 | 0.7261 | No | ||
| 20 | NFKBIB | 17906 | 4009 | 0.178 | 0.6810 | No | ||
| 21 | NFAT5 | 3921 7037 12036 | 4055 | 0.171 | 0.6818 | No | ||
| 22 | ITPKB | 3963 14028 | 4520 | 0.105 | 0.6588 | No | ||
| 23 | SOS1 | 5476 | 4708 | 0.086 | 0.6504 | No | ||
| 24 | PIK3R1 | 3170 | 4927 | 0.072 | 0.6400 | No | ||
| 25 | LYN | 16281 | 7117 | 0.012 | 0.5224 | No | ||
| 26 | BCR | 8478 3384 19990 | 7636 | 0.005 | 0.4946 | No | ||
| 27 | PIK3CA | 9562 | 7760 | 0.003 | 0.4881 | No | ||
| 28 | PPP1R13B | 10211 20980 | 8294 | -0.004 | 0.4595 | No | ||
| 29 | SHC1 | 9813 9812 5430 | 9137 | -0.016 | 0.4144 | No | ||
| 30 | AKT2 | 4365 4366 | 10089 | -0.030 | 0.3638 | No | ||
| 31 | AKT1 | 8568 | 13190 | -0.131 | 0.1995 | No | ||
| 32 | SYK | 21636 | 15479 | -0.643 | 0.0885 | No | ||
| 33 | MAP2K2 | 19933 | 15807 | -0.865 | 0.0873 | No | ||
| 34 | ITPKA | 14898 | 15875 | -0.916 | 0.1011 | No | ||
| 35 | BLNK | 23681 3691 | 16184 | -1.124 | 0.1059 | No | ||
| 36 | NFKBIA | 21065 | 16384 | -1.316 | 0.1201 | No |