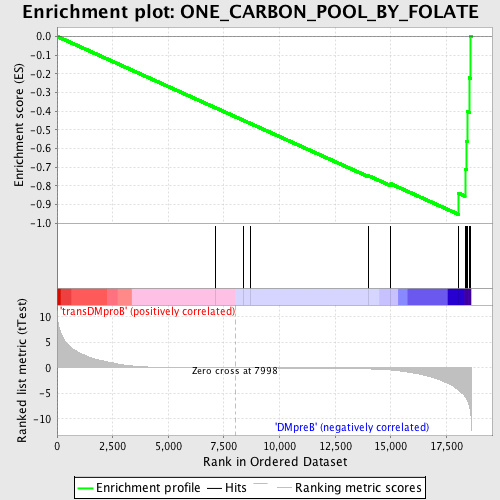
Profile of the Running ES Score & Positions of GeneSet Members on the Rank Ordered List
| Dataset | Set_04_transDMproB_versus_DMpreB.phenotype_transDMproB_versus_DMpreB.cls #transDMproB_versus_DMpreB.phenotype_transDMproB_versus_DMpreB.cls #transDMproB_versus_DMpreB_repos |
| Phenotype | phenotype_transDMproB_versus_DMpreB.cls#transDMproB_versus_DMpreB_repos |
| Upregulated in class | DMpreB |
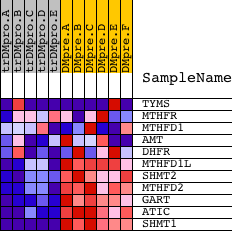
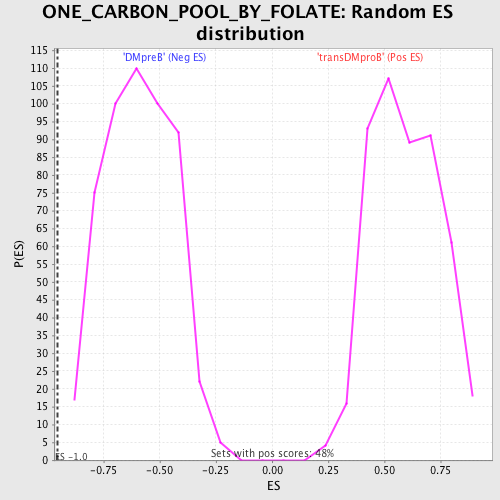
| GeneSet | ONE_CARBON_POOL_BY_FOLATE |
| Enrichment Score (ES) | -0.9532857 |
| Normalized Enrichment Score (NES) | -1.6189665 |
| Nominal p-value | 0.0 |
| FDR q-value | 0.05175501 |
| FWER p-Value | 0.365 |
| PROBE | DESCRIPTION (from dataset) | GENE SYMBOL | GENE_TITLE | RANK IN GENE LIST | RANK METRIC SCORE | RUNNING ES | CORE ENRICHMENT | |
|---|---|---|---|---|---|---|---|---|
| 1 | TYMS | 5810 5809 3606 3598 | 7118 | 0.012 | -0.3822 | No | ||
| 2 | MTHFR | 5130 | 8356 | -0.005 | -0.4486 | No | ||
| 3 | MTHFD1 | 2132 21238 | 8706 | -0.010 | -0.4671 | No | ||
| 4 | AMT | 322 | 14004 | -0.207 | -0.7465 | No | ||
| 5 | DHFR | 21590 | 15005 | -0.415 | -0.7895 | No | ||
| 6 | MTHFD1L | 11300 | 18053 | -4.409 | -0.8396 | Yes | ||
| 7 | SHMT2 | 3307 19601 | 18335 | -5.556 | -0.7114 | Yes | ||
| 8 | MTHFD2 | 17100 | 18395 | -5.971 | -0.5605 | Yes | ||
| 9 | GART | 22543 1754 | 18431 | -6.196 | -0.4026 | Yes | ||
| 10 | ATIC | 14231 3968 | 18524 | -7.214 | -0.2215 | Yes | ||
| 11 | SHMT1 | 5431 | 18587 | -8.775 | 0.0016 | Yes |