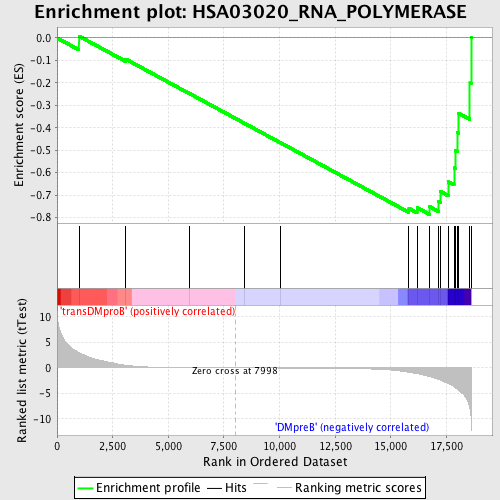
Profile of the Running ES Score & Positions of GeneSet Members on the Rank Ordered List
| Dataset | Set_04_transDMproB_versus_DMpreB.phenotype_transDMproB_versus_DMpreB.cls #transDMproB_versus_DMpreB.phenotype_transDMproB_versus_DMpreB.cls #transDMproB_versus_DMpreB_repos |
| Phenotype | phenotype_transDMproB_versus_DMpreB.cls#transDMproB_versus_DMpreB_repos |
| Upregulated in class | DMpreB |
| GeneSet | HSA03020_RNA_POLYMERASE |
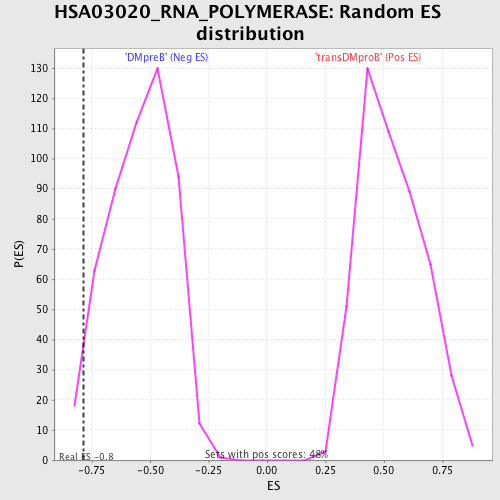
| Enrichment Score (ES) | -0.7860809 |
| Normalized Enrichment Score (NES) | -1.451987 |
| Nominal p-value | 0.03269231 |
| FDR q-value | 0.24460983 |
| FWER p-Value | 0.998 |
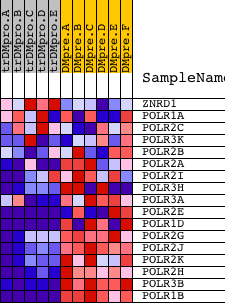
| PROBE | DESCRIPTION (from dataset) | GENE SYMBOL | GENE_TITLE | RANK IN GENE LIST | RANK METRIC SCORE | RUNNING ES | CORE ENRICHMENT | |
|---|---|---|---|---|---|---|---|---|
| 1 | ZNRD1 | 1491 22987 | 983 | 2.983 | 0.0083 | No | ||
| 2 | POLR1A | 9749 5393 | 3076 | 0.513 | -0.0936 | No | ||
| 3 | POLR2C | 9750 | 5936 | 0.034 | -0.2466 | No | ||
| 4 | POLR3K | 12447 7372 | 8411 | -0.006 | -0.3795 | No | ||
| 5 | POLR2B | 16817 | 10054 | -0.030 | -0.4672 | No | ||
| 6 | POLR2A | 5394 | 15814 | -0.870 | -0.7590 | Yes | ||
| 7 | POLR2I | 12839 | 16178 | -1.117 | -0.7555 | Yes | ||
| 8 | POLR3H | 13460 8135 | 16747 | -1.684 | -0.7515 | Yes | ||
| 9 | POLR3A | 21900 | 17155 | -2.229 | -0.7277 | Yes | ||
| 10 | POLR2E | 3325 19699 | 17221 | -2.334 | -0.6833 | Yes | ||
| 11 | POLR1D | 3593 3658 16623 | 17578 | -3.037 | -0.6401 | Yes | ||
| 12 | POLR2G | 23753 | 17842 | -3.679 | -0.5788 | Yes | ||
| 13 | POLR2J | 16672 | 17905 | -3.892 | -0.5023 | Yes | ||
| 14 | POLR2K | 9413 | 17988 | -4.160 | -0.4214 | Yes | ||
| 15 | POLR2H | 10888 | 18043 | -4.355 | -0.3349 | Yes | ||
| 16 | POLR3B | 12875 | 18557 | -7.903 | -0.2004 | Yes | ||
| 17 | POLR1B | 14857 | 18608 | -9.919 | 0.0004 | Yes |