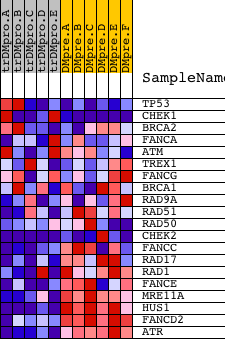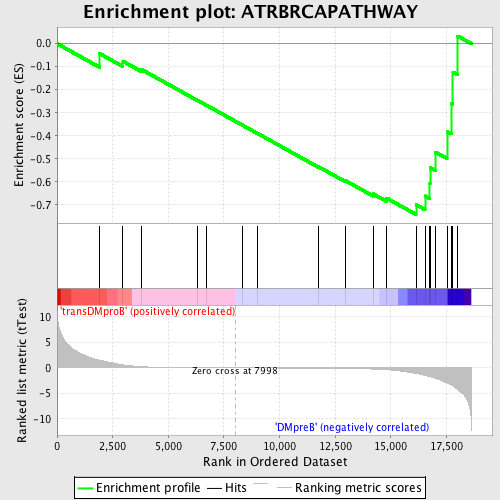
Profile of the Running ES Score & Positions of GeneSet Members on the Rank Ordered List
| Dataset | Set_04_transDMproB_versus_DMpreB.phenotype_transDMproB_versus_DMpreB.cls #transDMproB_versus_DMpreB.phenotype_transDMproB_versus_DMpreB.cls #transDMproB_versus_DMpreB_repos |
| Phenotype | phenotype_transDMproB_versus_DMpreB.cls#transDMproB_versus_DMpreB_repos |
| Upregulated in class | DMpreB |
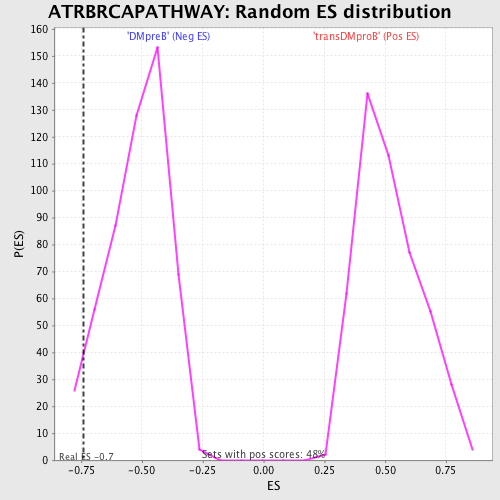
| GeneSet | ATRBRCAPATHWAY |
| Enrichment Score (ES) | -0.74184763 |
| Normalized Enrichment Score (NES) | -1.4292504 |
| Nominal p-value | 0.043977056 |
| FDR q-value | 0.29937604 |
| FWER p-Value | 1.0 |
| PROBE | DESCRIPTION (from dataset) | GENE SYMBOL | GENE_TITLE | RANK IN GENE LIST | RANK METRIC SCORE | RUNNING ES | CORE ENRICHMENT | |
|---|---|---|---|---|---|---|---|---|
| 1 | TP53 | 20822 | 1912 | 1.507 | -0.0431 | No | ||
| 2 | CHEK1 | 19181 3085 | 2960 | 0.576 | -0.0766 | No | ||
| 3 | BRCA2 | 16612 | 3782 | 0.236 | -0.1114 | No | ||
| 4 | FANCA | 18717 | 6299 | 0.026 | -0.2457 | No | ||
| 5 | ATM | 2976 19115 | 6719 | 0.018 | -0.2675 | No | ||
| 6 | TREX1 | 10219 3111 | 8331 | -0.005 | -0.3539 | No | ||
| 7 | FANCG | 15904 | 9016 | -0.014 | -0.3902 | No | ||
| 8 | BRCA1 | 20213 | 11755 | -0.064 | -0.5348 | No | ||
| 9 | RAD9A | 913 3674 910 23958 | 12944 | -0.116 | -0.5941 | No | ||
| 10 | RAD51 | 2897 14903 | 14202 | -0.234 | -0.6525 | No | ||
| 11 | RAD50 | 1198 20460 | 14815 | -0.361 | -0.6711 | No | ||
| 12 | CHEK2 | 16751 3587 | 16132 | -1.077 | -0.6992 | Yes | ||
| 13 | FANCC | 4712 | 16538 | -1.502 | -0.6615 | Yes | ||
| 14 | RAD17 | 21366 | 16755 | -1.691 | -0.6061 | Yes | ||
| 15 | RAD1 | 22507 | 16765 | -1.702 | -0.5392 | Yes | ||
| 16 | FANCE | 23318 | 17011 | -2.048 | -0.4713 | Yes | ||
| 17 | MRE11A | 3014 19560 | 17526 | -2.959 | -0.3817 | Yes | ||
| 18 | HUS1 | 9138 4890 | 17715 | -3.352 | -0.2591 | Yes | ||
| 19 | FANCD2 | 17326 464 | 17793 | -3.537 | -0.1231 | Yes | ||
| 20 | ATR | 19349 | 18008 | -4.225 | 0.0327 | Yes |