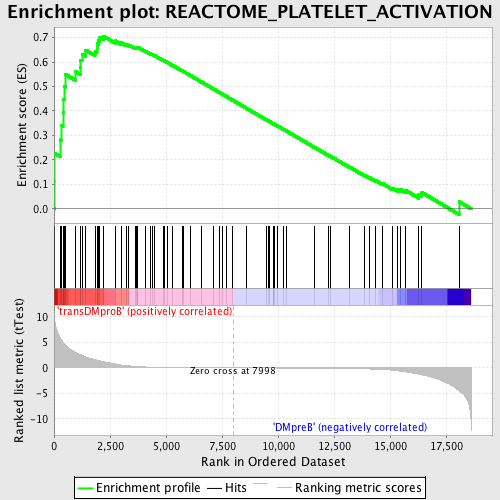
Profile of the Running ES Score & Positions of GeneSet Members on the Rank Ordered List
| Dataset | Set_04_transDMproB_versus_DMpreB.phenotype_transDMproB_versus_DMpreB.cls #transDMproB_versus_DMpreB.phenotype_transDMproB_versus_DMpreB.cls #transDMproB_versus_DMpreB_repos |
| Phenotype | phenotype_transDMproB_versus_DMpreB.cls#transDMproB_versus_DMpreB_repos |
| Upregulated in class | transDMproB |
| GeneSet | REACTOME_PLATELET_ACTIVATION |
| Enrichment Score (ES) | 0.70602965 |
| Normalized Enrichment Score (NES) | 1.718043 |
| Nominal p-value | 0.0 |
| FDR q-value | 0.04569521 |
| FWER p-Value | 0.105 |
| PROBE | DESCRIPTION (from dataset) | GENE SYMBOL | GENE_TITLE | RANK IN GENE LIST | RANK METRIC SCORE | RUNNING ES | CORE ENRICHMENT | |
|---|---|---|---|---|---|---|---|---|
| 1 | MMRN1 | 17428 | 19 | 9.904 | 0.1135 | Yes | ||
| 2 | TBXA2R | 3392 19928 | 20 | 9.841 | 0.2274 | Yes | ||
| 3 | PIK3CG | 6635 | 265 | 5.945 | 0.2830 | Yes | ||
| 4 | VAV1 | 23173 | 347 | 5.300 | 0.3399 | Yes | ||
| 5 | LAMP2 | 9267 2653 | 398 | 4.984 | 0.3948 | Yes | ||
| 6 | MAPK14 | 23313 | 429 | 4.797 | 0.4487 | Yes | ||
| 7 | PDPK1 | 23097 | 458 | 4.644 | 0.5009 | Yes | ||
| 8 | CD9 | 16992 | 516 | 4.428 | 0.5490 | Yes | ||
| 9 | GP5 | 22616 | 941 | 3.068 | 0.5617 | Yes | ||
| 10 | GNG2 | 4790 | 1174 | 2.571 | 0.5789 | Yes | ||
| 11 | PLCG2 | 18453 | 1181 | 2.559 | 0.6082 | Yes | ||
| 12 | STX4 | 18062 | 1247 | 2.422 | 0.6327 | Yes | ||
| 13 | APP | 4402 | 1401 | 2.142 | 0.6492 | Yes | ||
| 14 | GNA13 | 20617 | 1827 | 1.605 | 0.6449 | Yes | ||
| 15 | FCER1G | 13759 | 1915 | 1.500 | 0.6575 | Yes | ||
| 16 | CD63 | 8716 | 1920 | 1.491 | 0.6745 | Yes | ||
| 17 | GNB1 | 15967 | 1980 | 1.431 | 0.6879 | Yes | ||
| 18 | EGF | 15169 | 2044 | 1.359 | 0.7002 | Yes | ||
| 19 | PROS1 | 22725 | 2199 | 1.218 | 0.7060 | Yes | ||
| 20 | F8 | 2584 24123 | 2725 | 0.765 | 0.6866 | No | ||
| 21 | PPBP | 16801 | 2991 | 0.557 | 0.6787 | No | ||
| 22 | P2RY1 | 15581 | 3228 | 0.437 | 0.6711 | No | ||
| 23 | KNG1 | 9244 22809 | 3335 | 0.386 | 0.6698 | No | ||
| 24 | F2 | 14524 | 3610 | 0.281 | 0.6583 | No | ||
| 25 | PF4 | 16800 | 3680 | 0.262 | 0.6576 | No | ||
| 26 | F5 | 8941 | 3720 | 0.251 | 0.6584 | No | ||
| 27 | P2RX1 | 20794 1294 | 3721 | 0.251 | 0.6613 | No | ||
| 28 | SELP | 14073 | 4085 | 0.166 | 0.6437 | No | ||
| 29 | ACTN4 | 17905 1798 1983 | 4313 | 0.133 | 0.6329 | No | ||
| 30 | SERPING1 | 14546 | 4384 | 0.121 | 0.6306 | No | ||
| 31 | ITGA2B | 9186 | 4487 | 0.109 | 0.6263 | No | ||
| 32 | HRG | 22810 | 4863 | 0.075 | 0.6070 | No | ||
| 33 | PIK3R1 | 3170 | 4927 | 0.072 | 0.6044 | No | ||
| 34 | GP9 | 17374 | 5076 | 0.064 | 0.5972 | No | ||
| 35 | HGF | 16916 | 5269 | 0.056 | 0.5875 | No | ||
| 36 | TMSB4X | 24005 | 5727 | 0.040 | 0.5633 | No | ||
| 37 | F2RL2 | 21580 | 5759 | 0.039 | 0.5621 | No | ||
| 38 | FGB | 15309 | 6086 | 0.031 | 0.5449 | No | ||
| 39 | STXBP3 | 9931 | 6598 | 0.020 | 0.5175 | No | ||
| 40 | LYN | 16281 | 7117 | 0.012 | 0.4898 | No | ||
| 41 | SPARC | 20444 | 7402 | 0.008 | 0.4745 | No | ||
| 42 | FGG | 1891 | 7531 | 0.006 | 0.4677 | No | ||
| 43 | SERPINE1 | 16333 | 7699 | 0.004 | 0.4587 | No | ||
| 44 | THBS1 | 5748 14910 | 7978 | 0.000 | 0.4438 | No | ||
| 45 | CFD | 19957 | 8585 | -0.008 | 0.4112 | No | ||
| 46 | A2M | 17298 | 9501 | -0.021 | 0.3621 | No | ||
| 47 | FYN | 3375 3395 20052 | 9588 | -0.022 | 0.3577 | No | ||
| 48 | GNAQ | 4786 23909 3685 | 9625 | -0.023 | 0.3560 | No | ||
| 49 | PLG | 1593 23383 | 9798 | -0.025 | 0.3470 | No | ||
| 50 | GP1BB | 9031 | 9810 | -0.025 | 0.3467 | No | ||
| 51 | CLU | 21979 | 9823 | -0.026 | 0.3464 | No | ||
| 52 | GP1BA | 13683 | 9952 | -0.028 | 0.3398 | No | ||
| 53 | VWF | 17277 | 10218 | -0.032 | 0.3259 | No | ||
| 54 | LEFTY2 | 6735 | 10359 | -0.035 | 0.3188 | No | ||
| 55 | PLA2G4A | 13809 | 11626 | -0.061 | 0.2512 | No | ||
| 56 | FGA | 1780 15566 | 12250 | -0.081 | 0.2186 | No | ||
| 57 | CD36 | 8712 | 12339 | -0.086 | 0.2148 | No | ||
| 58 | AKT1 | 8568 | 13190 | -0.131 | 0.1705 | No | ||
| 59 | FN1 | 4091 4094 971 13929 | 13834 | -0.188 | 0.1380 | No | ||
| 60 | TIMP1 | 24366 | 14066 | -0.214 | 0.1280 | No | ||
| 61 | LCP2 | 4988 9268 | 14367 | -0.258 | 0.1148 | No | ||
| 62 | IGF1 | 3352 9156 3409 | 14678 | -0.326 | 0.1019 | No | ||
| 63 | SERPINF2 | 9589 20348 | 15112 | -0.458 | 0.0838 | No | ||
| 64 | PRKCZ | 5260 | 15328 | -0.546 | 0.0786 | No | ||
| 65 | SYK | 21636 | 15479 | -0.643 | 0.0779 | No | ||
| 66 | ITGB3 | 20631 | 15704 | -0.787 | 0.0749 | No | ||
| 67 | F2R | 21386 | 16286 | -1.215 | 0.0577 | No | ||
| 68 | ALDOA | 8572 | 16417 | -1.351 | 0.0663 | No | ||
| 69 | PIK3CB | 19030 | 18080 | -4.515 | 0.0289 | No |

