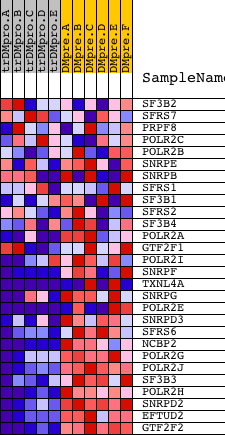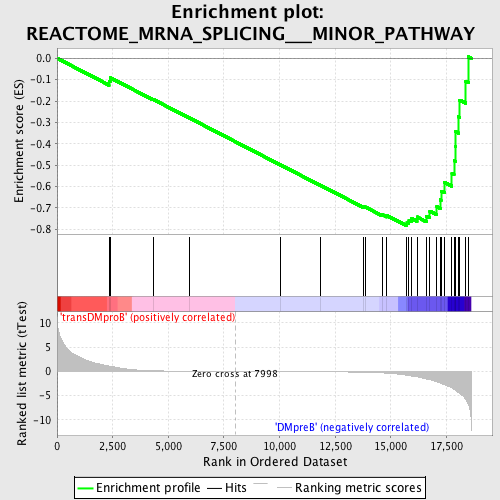
Profile of the Running ES Score & Positions of GeneSet Members on the Rank Ordered List
| Dataset | Set_04_transDMproB_versus_DMpreB.phenotype_transDMproB_versus_DMpreB.cls #transDMproB_versus_DMpreB.phenotype_transDMproB_versus_DMpreB.cls #transDMproB_versus_DMpreB_repos |
| Phenotype | phenotype_transDMproB_versus_DMpreB.cls#transDMproB_versus_DMpreB_repos |
| Upregulated in class | DMpreB |
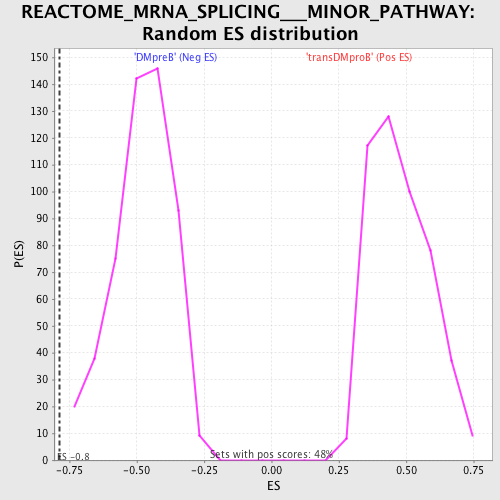
| GeneSet | REACTOME_MRNA_SPLICING___MINOR_PATHWAY |
| Enrichment Score (ES) | -0.7849 |
| Normalized Enrichment Score (NES) | -1.6399099 |
| Nominal p-value | 0.0 |
| FDR q-value | 0.02458545 |
| FWER p-Value | 0.372 |
| PROBE | DESCRIPTION (from dataset) | GENE SYMBOL | GENE_TITLE | RANK IN GENE LIST | RANK METRIC SCORE | RUNNING ES | CORE ENRICHMENT | |
|---|---|---|---|---|---|---|---|---|
| 1 | SF3B2 | 23974 | 2334 | 1.088 | -0.1063 | No | ||
| 2 | SFRS7 | 22889 | 2401 | 1.027 | -0.0917 | No | ||
| 3 | PRPF8 | 20780 1371 | 4324 | 0.131 | -0.1928 | No | ||
| 4 | POLR2C | 9750 | 5936 | 0.034 | -0.2788 | No | ||
| 5 | POLR2B | 16817 | 10054 | -0.030 | -0.4998 | No | ||
| 6 | SNRPE | 9843 | 11850 | -0.067 | -0.5952 | No | ||
| 7 | SNRPB | 9842 5469 2736 | 13755 | -0.181 | -0.6944 | No | ||
| 8 | SFRS1 | 8492 | 13847 | -0.190 | -0.6959 | No | ||
| 9 | SF3B1 | 13954 | 14620 | -0.312 | -0.7319 | No | ||
| 10 | SFRS2 | 9807 20136 | 14825 | -0.363 | -0.7365 | No | ||
| 11 | SF3B4 | 22269 | 15726 | -0.807 | -0.7706 | Yes | ||
| 12 | POLR2A | 5394 | 15814 | -0.870 | -0.7599 | Yes | ||
| 13 | GTF2F1 | 13599 | 15922 | -0.958 | -0.7487 | Yes | ||
| 14 | POLR2I | 12839 | 16178 | -1.117 | -0.7427 | Yes | ||
| 15 | SNRPF | 7645 | 16611 | -1.562 | -0.7383 | Yes | ||
| 16 | TXNL4A | 6567 11329 | 16753 | -1.689 | -0.7160 | Yes | ||
| 17 | SNRPG | 12622 | 17069 | -2.131 | -0.6953 | Yes | ||
| 18 | POLR2E | 3325 19699 | 17221 | -2.334 | -0.6621 | Yes | ||
| 19 | SNRPD3 | 12514 | 17260 | -2.426 | -0.6213 | Yes | ||
| 20 | SFRS6 | 14751 | 17415 | -2.724 | -0.5814 | Yes | ||
| 21 | NCBP2 | 12643 | 17747 | -3.425 | -0.5386 | Yes | ||
| 22 | POLR2G | 23753 | 17842 | -3.679 | -0.4786 | Yes | ||
| 23 | POLR2J | 16672 | 17905 | -3.892 | -0.4131 | Yes | ||
| 24 | SF3B3 | 18746 | 17915 | -3.934 | -0.3440 | Yes | ||
| 25 | POLR2H | 10888 | 18043 | -4.355 | -0.2738 | Yes | ||
| 26 | SNRPD2 | 8412 | 18097 | -4.591 | -0.1955 | Yes | ||
| 27 | EFTUD2 | 1219 20203 | 18369 | -5.754 | -0.1083 | Yes | ||
| 28 | GTF2F2 | 21750 | 18491 | -6.869 | 0.0067 | Yes |