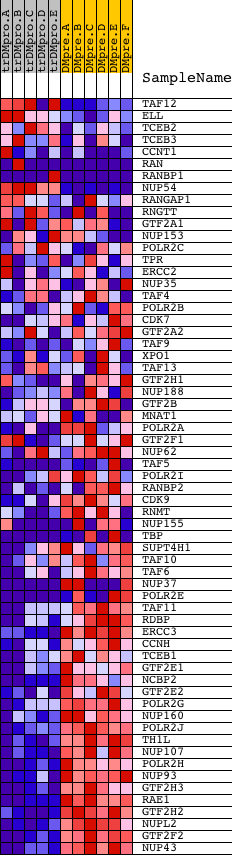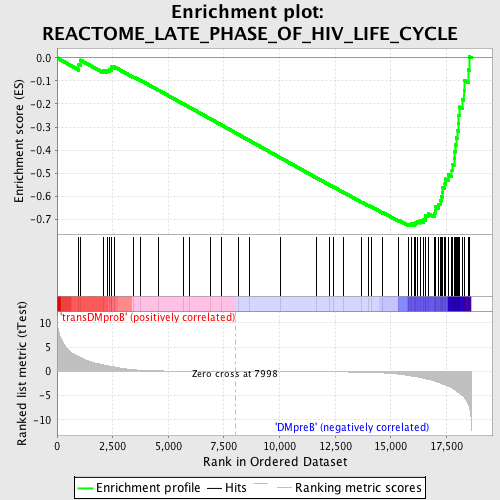
Profile of the Running ES Score & Positions of GeneSet Members on the Rank Ordered List
| Dataset | Set_04_transDMproB_versus_DMpreB.phenotype_transDMproB_versus_DMpreB.cls #transDMproB_versus_DMpreB.phenotype_transDMproB_versus_DMpreB.cls #transDMproB_versus_DMpreB_repos |
| Phenotype | phenotype_transDMproB_versus_DMpreB.cls#transDMproB_versus_DMpreB_repos |
| Upregulated in class | DMpreB |
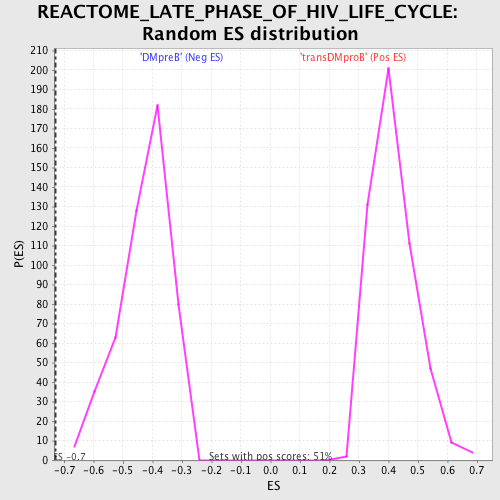
| GeneSet | REACTOME_LATE_PHASE_OF_HIV_LIFE_CYCLE |
| Enrichment Score (ES) | -0.7298615 |
| Normalized Enrichment Score (NES) | -1.7162609 |
| Nominal p-value | 0.0 |
| FDR q-value | 0.016950393 |
| FWER p-Value | 0.063 |
| PROBE | DESCRIPTION (from dataset) | GENE SYMBOL | GENE_TITLE | RANK IN GENE LIST | RANK METRIC SCORE | RUNNING ES | CORE ENRICHMENT | |
|---|---|---|---|---|---|---|---|---|
| 1 | TAF12 | 2537 16058 2338 | 979 | 2.991 | -0.0286 | No | ||
| 2 | ELL | 18586 | 1041 | 2.850 | -0.0089 | No | ||
| 3 | TCEB2 | 12563 23102 7476 | 2076 | 1.333 | -0.0538 | No | ||
| 4 | TCEB3 | 15707 | 2243 | 1.172 | -0.0533 | No | ||
| 5 | CCNT1 | 22140 11607 | 2349 | 1.081 | -0.0502 | No | ||
| 6 | RAN | 5356 9691 | 2444 | 1.000 | -0.0472 | No | ||
| 7 | RANBP1 | 9692 5357 | 2445 | 1.000 | -0.0392 | No | ||
| 8 | NUP54 | 11231 11232 6516 | 2571 | 0.901 | -0.0386 | No | ||
| 9 | RANGAP1 | 2180 22195 | 3447 | 0.342 | -0.0830 | No | ||
| 10 | RNGTT | 10769 2354 6272 | 3737 | 0.247 | -0.0966 | No | ||
| 11 | GTF2A1 | 2064 8187 8188 13512 | 4575 | 0.098 | -0.1409 | No | ||
| 12 | NUP153 | 21474 | 5681 | 0.041 | -0.2002 | No | ||
| 13 | POLR2C | 9750 | 5936 | 0.034 | -0.2136 | No | ||
| 14 | TPR | 927 4255 | 6877 | 0.016 | -0.2641 | No | ||
| 15 | ERCC2 | 1549 18363 3812 | 7384 | 0.008 | -0.2913 | No | ||
| 16 | NUP35 | 12803 | 8155 | -0.002 | -0.3328 | No | ||
| 17 | TAF4 | 14319 | 8626 | -0.008 | -0.3581 | No | ||
| 18 | POLR2B | 16817 | 10054 | -0.030 | -0.4347 | No | ||
| 19 | CDK7 | 21365 | 11650 | -0.061 | -0.5202 | No | ||
| 20 | GTF2A2 | 10654 | 12265 | -0.082 | -0.5526 | No | ||
| 21 | TAF9 | 3213 8433 | 12406 | -0.089 | -0.5595 | No | ||
| 22 | XPO1 | 4172 | 12880 | -0.112 | -0.5840 | No | ||
| 23 | TAF13 | 8288 | 13683 | -0.173 | -0.6259 | No | ||
| 24 | GTF2H1 | 4069 18236 | 13978 | -0.204 | -0.6401 | No | ||
| 25 | NUP188 | 15053 | 14132 | -0.223 | -0.6465 | No | ||
| 26 | GTF2B | 10489 | 14646 | -0.316 | -0.6716 | No | ||
| 27 | MNAT1 | 9396 2161 | 15363 | -0.569 | -0.7056 | No | ||
| 28 | POLR2A | 5394 | 15814 | -0.870 | -0.7228 | Yes | ||
| 29 | GTF2F1 | 13599 | 15922 | -0.958 | -0.7209 | Yes | ||
| 30 | NUP62 | 9497 | 16051 | -1.023 | -0.7195 | Yes | ||
| 31 | TAF5 | 23833 5934 3759 | 16122 | -1.071 | -0.7146 | Yes | ||
| 32 | POLR2I | 12839 | 16178 | -1.117 | -0.7086 | Yes | ||
| 33 | RANBP2 | 20019 | 16336 | -1.259 | -0.7069 | Yes | ||
| 34 | CDK9 | 14619 | 16469 | -1.426 | -0.7025 | Yes | ||
| 35 | RNMT | 7501 | 16547 | -1.511 | -0.6944 | Yes | ||
| 36 | NUP155 | 2298 5027 | 16563 | -1.521 | -0.6829 | Yes | ||
| 37 | TBP | 671 1554 | 16689 | -1.625 | -0.6765 | Yes | ||
| 38 | SUPT4H1 | 9938 | 16949 | -1.956 | -0.6747 | Yes | ||
| 39 | TAF10 | 10785 | 16990 | -2.022 | -0.6605 | Yes | ||
| 40 | TAF6 | 16322 891 | 17014 | -2.052 | -0.6452 | Yes | ||
| 41 | NUP37 | 3294 3326 19909 | 17158 | -2.232 | -0.6349 | Yes | ||
| 42 | POLR2E | 3325 19699 | 17221 | -2.334 | -0.6194 | Yes | ||
| 43 | TAF11 | 12733 | 17261 | -2.429 | -0.6018 | Yes | ||
| 44 | RDBP | 6589 | 17325 | -2.577 | -0.5844 | Yes | ||
| 45 | ERCC3 | 23605 | 17337 | -2.596 | -0.5640 | Yes | ||
| 46 | CCNH | 7322 | 17431 | -2.762 | -0.5468 | Yes | ||
| 47 | TCEB1 | 13995 | 17465 | -2.829 | -0.5257 | Yes | ||
| 48 | GTF2E1 | 22597 | 17583 | -3.047 | -0.5074 | Yes | ||
| 49 | NCBP2 | 12643 | 17747 | -3.425 | -0.4885 | Yes | ||
| 50 | GTF2E2 | 18635 | 17760 | -3.460 | -0.4612 | Yes | ||
| 51 | POLR2G | 23753 | 17842 | -3.679 | -0.4359 | Yes | ||
| 52 | NUP160 | 14957 | 17870 | -3.756 | -0.4070 | Yes | ||
| 53 | POLR2J | 16672 | 17905 | -3.892 | -0.3774 | Yes | ||
| 54 | TH1L | 14715 | 17931 | -3.986 | -0.3465 | Yes | ||
| 55 | NUP107 | 8337 | 18011 | -4.236 | -0.3166 | Yes | ||
| 56 | POLR2H | 10888 | 18043 | -4.355 | -0.2831 | Yes | ||
| 57 | NUP93 | 7762 | 18055 | -4.422 | -0.2480 | Yes | ||
| 58 | GTF2H3 | 5551 | 18092 | -4.576 | -0.2129 | Yes | ||
| 59 | RAE1 | 12395 | 18206 | -4.967 | -0.1789 | Yes | ||
| 60 | GTF2H2 | 6236 | 18289 | -5.254 | -0.1409 | Yes | ||
| 61 | NUPL2 | 6072 | 18324 | -5.505 | -0.0983 | Yes | ||
| 62 | GTF2F2 | 21750 | 18491 | -6.869 | -0.0517 | Yes | ||
| 63 | NUP43 | 20094 | 18528 | -7.233 | 0.0047 | Yes |