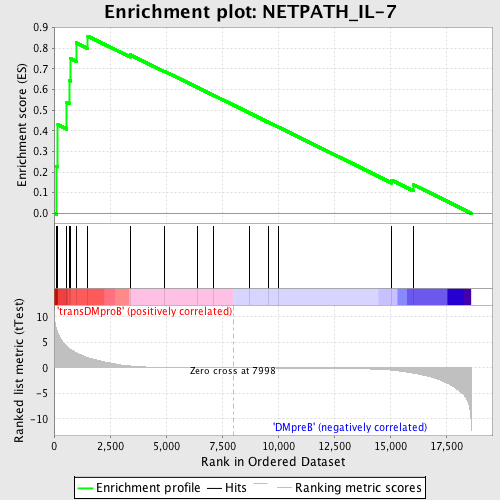
Profile of the Running ES Score & Positions of GeneSet Members on the Rank Ordered List
| Dataset | Set_04_transDMproB_versus_DMpreB.phenotype_transDMproB_versus_DMpreB.cls #transDMproB_versus_DMpreB.phenotype_transDMproB_versus_DMpreB.cls #transDMproB_versus_DMpreB_repos |
| Phenotype | phenotype_transDMproB_versus_DMpreB.cls#transDMproB_versus_DMpreB_repos |
| Upregulated in class | transDMproB |
| GeneSet | NETPATH_IL-7 |
| Enrichment Score (ES) | 0.859102 |
| Normalized Enrichment Score (NES) | 1.5699898 |
| Nominal p-value | 0.012605042 |
| FDR q-value | 0.20620766 |
| FWER p-Value | 0.909 |
| PROBE | DESCRIPTION (from dataset) | GENE SYMBOL | GENE_TITLE | RANK IN GENE LIST | RANK METRIC SCORE | RUNNING ES | CORE ENRICHMENT | |
|---|---|---|---|---|---|---|---|---|
| 1 | JAK3 | 9198 4936 | 107 | 7.705 | 0.2278 | Yes | ||
| 2 | IL7R | 9175 4922 | 170 | 6.753 | 0.4292 | Yes | ||
| 3 | STAT3 | 5525 9906 | 569 | 4.247 | 0.5365 | Yes | ||
| 4 | MCL1 | 15502 | 689 | 3.730 | 0.6432 | Yes | ||
| 5 | STAT5A | 20664 | 727 | 3.634 | 0.7513 | Yes | ||
| 6 | JAK1 | 15827 | 996 | 2.955 | 0.8265 | Yes | ||
| 7 | PTK2B | 21776 | 1509 | 1.984 | 0.8591 | Yes | ||
| 8 | IL7 | 4921 | 3396 | 0.362 | 0.7687 | No | ||
| 9 | PIK3R1 | 3170 | 4927 | 0.072 | 0.6886 | No | ||
| 10 | INSL3 | 9181 | 6415 | 0.024 | 0.6094 | No | ||
| 11 | LYN | 16281 | 7117 | 0.012 | 0.5721 | No | ||
| 12 | STAT5B | 20222 | 8729 | -0.010 | 0.4858 | No | ||
| 13 | FYN | 3375 3395 20052 | 9588 | -0.022 | 0.4403 | No | ||
| 14 | IRS1 | 4925 | 10031 | -0.029 | 0.4174 | No | ||
| 15 | IL2RG | 24096 | 15069 | -0.442 | 0.1600 | No | ||
| 16 | BCL2L11 | 2790 14861 | 16028 | -1.009 | 0.1391 | No |

