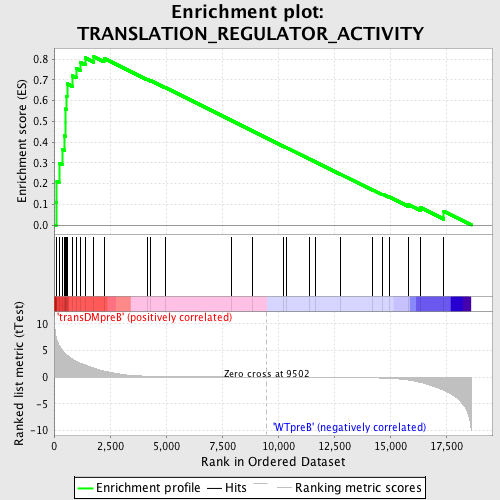
Profile of the Running ES Score & Positions of GeneSet Members on the Rank Ordered List
| Dataset | Set_04_transDMpreB_versus_WTpreB.phenotype_transDMpreB_versus_WTpreB.cls #transDMpreB_versus_WTpreB |
| Phenotype | phenotype_transDMpreB_versus_WTpreB.cls#transDMpreB_versus_WTpreB |
| Upregulated in class | transDMpreB |
| GeneSet | TRANSLATION_REGULATOR_ACTIVITY |
| Enrichment Score (ES) | 0.81106484 |
| Normalized Enrichment Score (NES) | 1.6541387 |
| Nominal p-value | 0.0019455253 |
| FDR q-value | 0.019917713 |
| FWER p-Value | 0.259 |

| PROBE | DESCRIPTION (from dataset) | GENE SYMBOL | GENE_TITLE | RANK IN GENE LIST | RANK METRIC SCORE | RUNNING ES | CORE ENRICHMENT | |
|---|---|---|---|---|---|---|---|---|
| 1 | EIF2B3 | 16118 | 87 | 7.555 | 0.1093 | Yes | ||
| 2 | EIF5A | 11345 20379 6590 | 125 | 6.952 | 0.2122 | Yes | ||
| 3 | EIF4G1 | 22818 | 222 | 5.960 | 0.2970 | Yes | ||
| 4 | GSPT1 | 9046 | 357 | 5.076 | 0.3663 | Yes | ||
| 5 | PET112L | 1824 15563 1819 | 457 | 4.612 | 0.4306 | Yes | ||
| 6 | EIF2B1 | 16368 3458 | 513 | 4.387 | 0.4938 | Yes | ||
| 7 | GTF2H3 | 5551 | 514 | 4.365 | 0.5597 | Yes | ||
| 8 | TUFM | 10608 | 561 | 4.171 | 0.6201 | Yes | ||
| 9 | COPS5 | 4117 14002 | 578 | 4.109 | 0.6813 | Yes | ||
| 10 | EIF2B5 | 1719 22822 | 812 | 3.400 | 0.7200 | Yes | ||
| 11 | ABCF1 | 22996 10329 5897 | 988 | 2.929 | 0.7548 | Yes | ||
| 12 | EIF4B | 13279 7979 | 1178 | 2.575 | 0.7835 | Yes | ||
| 13 | EIF2B4 | 16574 | 1390 | 2.251 | 0.8061 | Yes | ||
| 14 | GTF2H2 | 6236 | 1769 | 1.678 | 0.8111 | Yes | ||
| 15 | EIF4H | 16352 | 2229 | 1.125 | 0.8033 | No | ||
| 16 | PAIP1 | 21556 | 4149 | 0.171 | 0.7027 | No | ||
| 17 | EIF2S1 | 4658 | 4310 | 0.151 | 0.6963 | No | ||
| 18 | MTRF1 | 3413 21949 | 4969 | 0.099 | 0.6624 | No | ||
| 19 | PABPC1 | 5219 9522 9523 23572 | 7921 | 0.021 | 0.5040 | No | ||
| 20 | DAZL | 22944 | 8852 | 0.008 | 0.4540 | No | ||
| 21 | SAMD4A | 13211 | 10236 | -0.010 | 0.3798 | No | ||
| 22 | GSPT2 | 4806 | 10387 | -0.012 | 0.3719 | No | ||
| 23 | EIF4E | 15403 1827 8890 | 11391 | -0.025 | 0.3183 | No | ||
| 24 | EIF2C1 | 10672 | 11652 | -0.030 | 0.3048 | No | ||
| 25 | EEF2K | 18101 | 12799 | -0.055 | 0.2439 | No | ||
| 26 | BOLL | 7960 | 14234 | -0.130 | 0.1687 | No | ||
| 27 | EIF4G2 | 1908 8892 | 14659 | -0.178 | 0.1486 | No | ||
| 28 | EIF2B2 | 21204 | 14972 | -0.230 | 0.1353 | No | ||
| 29 | EIF2S2 | 7406 14383 | 15832 | -0.534 | 0.0972 | No | ||
| 30 | EIF4A2 | 4660 1679 1645 | 16353 | -1.000 | 0.0843 | No | ||
| 31 | PAIP2 | 12593 | 17398 | -2.482 | 0.0655 | No |

