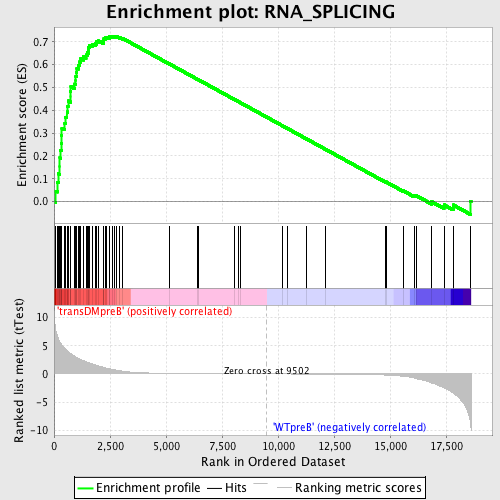
Profile of the Running ES Score & Positions of GeneSet Members on the Rank Ordered List
| Dataset | Set_04_transDMpreB_versus_WTpreB.phenotype_transDMpreB_versus_WTpreB.cls #transDMpreB_versus_WTpreB |
| Phenotype | phenotype_transDMpreB_versus_WTpreB.cls#transDMpreB_versus_WTpreB |
| Upregulated in class | transDMpreB |
| GeneSet | RNA_SPLICING |
| Enrichment Score (ES) | 0.72489536 |
| Normalized Enrichment Score (NES) | 1.6553831 |
| Nominal p-value | 0.002004008 |
| FDR q-value | 0.02082903 |
| FWER p-Value | 0.251 |
| PROBE | DESCRIPTION (from dataset) | GENE SYMBOL | GENE_TITLE | RANK IN GENE LIST | RANK METRIC SCORE | RUNNING ES | CORE ENRICHMENT | |
|---|---|---|---|---|---|---|---|---|
| 1 | SRPK1 | 23049 | 72 | 7.805 | 0.0460 | Yes | ||
| 2 | SNRPD3 | 12514 | 144 | 6.702 | 0.0850 | Yes | ||
| 3 | SNRPD1 | 23622 | 192 | 6.236 | 0.1223 | Yes | ||
| 4 | SFRS6 | 14751 | 257 | 5.683 | 0.1551 | Yes | ||
| 5 | U2AF1 | 8431 | 259 | 5.676 | 0.1914 | Yes | ||
| 6 | EFTUD2 | 1219 20203 | 290 | 5.524 | 0.2250 | Yes | ||
| 7 | LSM4 | 18583 | 328 | 5.239 | 0.2565 | Yes | ||
| 8 | SNRPF | 7645 | 340 | 5.175 | 0.2890 | Yes | ||
| 9 | NCBP2 | 12643 | 349 | 5.124 | 0.3213 | Yes | ||
| 10 | SF3B3 | 18746 | 478 | 4.530 | 0.3433 | Yes | ||
| 11 | PPAN | 19546 | 501 | 4.439 | 0.3705 | Yes | ||
| 12 | SNRPD2 | 8412 | 575 | 4.118 | 0.3929 | Yes | ||
| 13 | SF3A3 | 16091 | 608 | 4.011 | 0.4168 | Yes | ||
| 14 | PHF5A | 22194 | 627 | 3.958 | 0.4411 | Yes | ||
| 15 | GEMIN5 | 20439 | 733 | 3.602 | 0.4584 | Yes | ||
| 16 | DBR1 | 19341 | 734 | 3.601 | 0.4814 | Yes | ||
| 17 | SNRPG | 12622 | 750 | 3.566 | 0.5034 | Yes | ||
| 18 | SNRP70 | 1186 | 904 | 3.142 | 0.5152 | Yes | ||
| 19 | ASCC3L1 | 14867 | 967 | 2.974 | 0.5309 | Yes | ||
| 20 | PRPF8 | 20780 1371 | 971 | 2.965 | 0.5497 | Yes | ||
| 21 | PTBP1 | 5303 | 996 | 2.908 | 0.5670 | Yes | ||
| 22 | SF3B2 | 23974 | 1017 | 2.858 | 0.5842 | Yes | ||
| 23 | SIP1 | 21263 | 1083 | 2.751 | 0.5982 | Yes | ||
| 24 | DDX39 | 18551 | 1147 | 2.643 | 0.6117 | Yes | ||
| 25 | PRPF3 | 12899 12898 1877 7703 | 1193 | 2.545 | 0.6255 | Yes | ||
| 26 | ZNF638 | 9476 | 1298 | 2.390 | 0.6352 | Yes | ||
| 27 | SF3A1 | 7450 | 1425 | 2.194 | 0.6424 | Yes | ||
| 28 | DHX38 | 48 | 1498 | 2.058 | 0.6517 | Yes | ||
| 29 | DDX20 | 15213 | 1524 | 2.019 | 0.6633 | Yes | ||
| 30 | BCAS2 | 12662 | 1541 | 1.992 | 0.6751 | Yes | ||
| 31 | SFRS5 | 9808 2062 | 1583 | 1.930 | 0.6852 | Yes | ||
| 32 | USP39 | 1116 1083 11373 | 1701 | 1.767 | 0.6902 | Yes | ||
| 33 | SFRS1 | 8492 | 1857 | 1.596 | 0.6921 | Yes | ||
| 34 | SYNCRIP | 3078 3035 3107 | 1899 | 1.539 | 0.6997 | Yes | ||
| 35 | SFRS9 | 16731 | 1989 | 1.418 | 0.7039 | Yes | ||
| 36 | SFPQ | 12936 | 2197 | 1.158 | 0.7002 | Yes | ||
| 37 | IVNS1ABP | 4384 4050 | 2199 | 1.155 | 0.7075 | Yes | ||
| 38 | SFRS2 | 9807 20136 | 2224 | 1.131 | 0.7134 | Yes | ||
| 39 | DHX8 | 20649 | 2280 | 1.052 | 0.7172 | Yes | ||
| 40 | FUSIP1 | 4715 16036 | 2330 | 1.013 | 0.7210 | Yes | ||
| 41 | NONO | 11993 | 2473 | 0.919 | 0.7192 | Yes | ||
| 42 | SFRS2IP | 7794 13009 | 2477 | 0.912 | 0.7249 | Yes | ||
| 43 | DHX16 | 23247 | 2611 | 0.820 | 0.7230 | No | ||
| 44 | PRPF31 | 7594 | 2674 | 0.769 | 0.7245 | No | ||
| 45 | SFRS7 | 22889 | 2779 | 0.674 | 0.7232 | No | ||
| 46 | SF3A2 | 19938 | 2930 | 0.566 | 0.7188 | No | ||
| 47 | SNRPB | 9842 5469 2736 | 3074 | 0.477 | 0.7141 | No | ||
| 48 | CUGBP1 | 2805 8819 4576 2924 | 5128 | 0.089 | 0.6040 | No | ||
| 49 | SF3B4 | 22269 | 6421 | 0.046 | 0.5346 | No | ||
| 50 | SNRPN | 1715 9844 5471 | 6450 | 0.045 | 0.5334 | No | ||
| 51 | SFRS10 | 9818 1722 5441 | 8049 | 0.019 | 0.4474 | No | ||
| 52 | HNRPF | 13607 | 8227 | 0.017 | 0.4380 | No | ||
| 53 | RNPS1 | 9730 23361 | 8339 | 0.015 | 0.4321 | No | ||
| 54 | GEMIN6 | 12492 7415 | 10191 | -0.009 | 0.3324 | No | ||
| 55 | PRPF4B | 3208 5295 | 10398 | -0.012 | 0.3213 | No | ||
| 56 | SNRPB2 | 5470 | 11258 | -0.023 | 0.2752 | No | ||
| 57 | SNW1 | 7282 | 12119 | -0.038 | 0.2291 | No | ||
| 58 | NOL3 | 18496 915 921 | 14779 | -0.195 | 0.0870 | No | ||
| 59 | SRRM1 | 6958 | 14816 | -0.201 | 0.0863 | No | ||
| 60 | SFRS8 | 10543 6089 | 15575 | -0.413 | 0.0481 | No | ||
| 61 | PPARGC1A | 16533 | 16090 | -0.735 | 0.0251 | No | ||
| 62 | SRPK2 | 5513 | 16172 | -0.834 | 0.0260 | No | ||
| 63 | TXNL4A | 6567 11329 | 16855 | -1.602 | -0.0005 | No | ||
| 64 | CRNKL1 | 14407 | 17407 | -2.495 | -0.0142 | No | ||
| 65 | GEMIN7 | 17944 | 17816 | -3.414 | -0.0144 | No | ||
| 66 | SNRPA1 | 1373 18216 | 18592 | -9.000 | 0.0013 | No |

