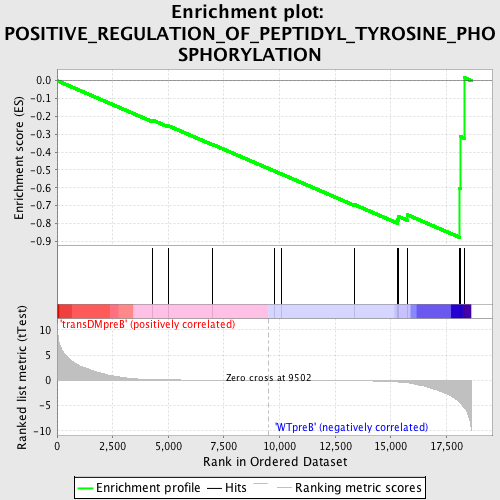
Profile of the Running ES Score & Positions of GeneSet Members on the Rank Ordered List
| Dataset | Set_04_transDMpreB_versus_WTpreB.phenotype_transDMpreB_versus_WTpreB.cls #transDMpreB_versus_WTpreB |
| Phenotype | phenotype_transDMpreB_versus_WTpreB.cls#transDMpreB_versus_WTpreB |
| Upregulated in class | WTpreB |
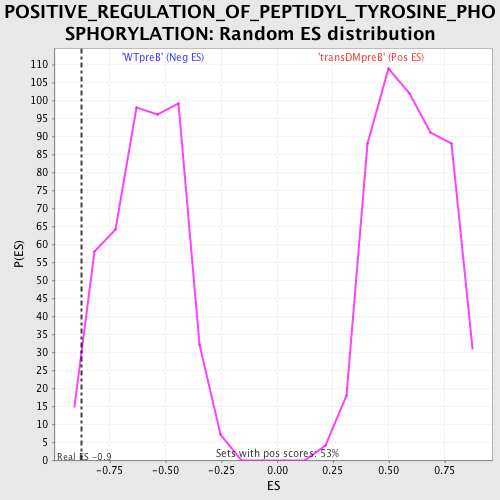
| GeneSet | POSITIVE_REGULATION_OF_PEPTIDYL_TYROSINE_PHOSPHORYLATION |
| Enrichment Score (ES) | -0.87827355 |
| Normalized Enrichment Score (NES) | -1.4913157 |
| Nominal p-value | 0.01705757 |
| FDR q-value | 0.88552445 |
| FWER p-Value | 0.998 |
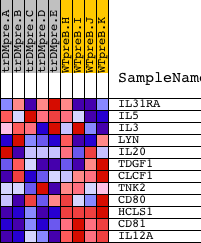
| PROBE | DESCRIPTION (from dataset) | GENE SYMBOL | GENE_TITLE | RANK IN GENE LIST | RANK METRIC SCORE | RUNNING ES | CORE ENRICHMENT | |
|---|---|---|---|---|---|---|---|---|
| 1 | IL31RA | 21347 | 4298 | 0.152 | -0.2213 | No | ||
| 2 | IL5 | 20884 10220 | 5008 | 0.096 | -0.2533 | No | ||
| 3 | IL3 | 20453 | 6994 | 0.035 | -0.3578 | No | ||
| 4 | LYN | 16281 | 9750 | -0.003 | -0.5056 | No | ||
| 5 | IL20 | 13840 | 10097 | -0.008 | -0.5237 | No | ||
| 6 | TDGF1 | 5704 10108 | 13359 | -0.075 | -0.6943 | No | ||
| 7 | CLCF1 | 12160 3742 | 15289 | -0.306 | -0.7785 | Yes | ||
| 8 | TNK2 | 22784 | 15354 | -0.323 | -0.7613 | Yes | ||
| 9 | CD80 | 22758 | 15736 | -0.482 | -0.7511 | Yes | ||
| 10 | HCLS1 | 22770 | 18103 | -4.347 | -0.6014 | Yes | ||
| 11 | CD81 | 8719 | 18143 | -4.545 | -0.3140 | Yes | ||
| 12 | IL12A | 4913 | 18294 | -5.328 | 0.0173 | Yes |