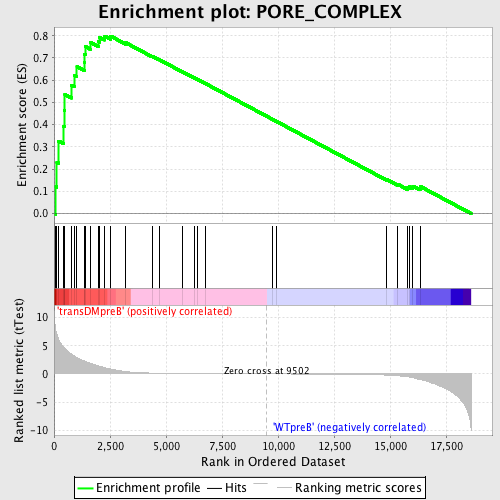
Profile of the Running ES Score & Positions of GeneSet Members on the Rank Ordered List
| Dataset | Set_04_transDMpreB_versus_WTpreB.phenotype_transDMpreB_versus_WTpreB.cls #transDMpreB_versus_WTpreB |
| Phenotype | phenotype_transDMpreB_versus_WTpreB.cls#transDMpreB_versus_WTpreB |
| Upregulated in class | transDMpreB |
| GeneSet | PORE_COMPLEX |
| Enrichment Score (ES) | 0.7984064 |
| Normalized Enrichment Score (NES) | 1.6157292 |
| Nominal p-value | 0.0018903592 |
| FDR q-value | 0.03492126 |
| FWER p-Value | 0.538 |
| PROBE | DESCRIPTION (from dataset) | GENE SYMBOL | GENE_TITLE | RANK IN GENE LIST | RANK METRIC SCORE | RUNNING ES | CORE ENRICHMENT | |
|---|---|---|---|---|---|---|---|---|
| 1 | RANBP5 | 21930 | 75 | 7.743 | 0.1209 | Yes | ||
| 2 | EIF5A | 11345 20379 6590 | 125 | 6.952 | 0.2305 | Yes | ||
| 3 | KPNB1 | 20274 | 202 | 6.157 | 0.3258 | Yes | ||
| 4 | RAE1 | 12395 | 415 | 4.823 | 0.3922 | Yes | ||
| 5 | VDAC1 | 10282 | 461 | 4.601 | 0.4640 | Yes | ||
| 6 | NUP107 | 8337 | 481 | 4.522 | 0.5360 | Yes | ||
| 7 | NUTF2 | 12632 7529 | 781 | 3.496 | 0.5763 | Yes | ||
| 8 | BAX | 17832 | 898 | 3.158 | 0.6210 | Yes | ||
| 9 | NUP62 | 9497 | 1020 | 2.854 | 0.6606 | Yes | ||
| 10 | SUMO1 | 5826 3943 10247 | 1350 | 2.328 | 0.6804 | Yes | ||
| 11 | AAAS | 22111 2274 | 1361 | 2.315 | 0.7172 | Yes | ||
| 12 | RANBP2 | 20019 | 1406 | 2.225 | 0.7508 | Yes | ||
| 13 | NUP160 | 14957 | 1613 | 1.888 | 0.7702 | Yes | ||
| 14 | XPO7 | 12272 7239 | 1973 | 1.435 | 0.7740 | Yes | ||
| 15 | NUP88 | 20365 1316 | 2020 | 1.374 | 0.7937 | Yes | ||
| 16 | KPNA3 | 21797 | 2260 | 1.077 | 0.7982 | Yes | ||
| 17 | SNUPN | 12282 | 2523 | 0.885 | 0.7984 | Yes | ||
| 18 | DDX19B | 8888 | 3208 | 0.407 | 0.7682 | No | ||
| 19 | BAK1 | 23058 | 4388 | 0.142 | 0.7070 | No | ||
| 20 | NUP133 | 3849 18714 | 4687 | 0.116 | 0.6929 | No | ||
| 21 | NUP98 | 17726 | 5721 | 0.064 | 0.6383 | No | ||
| 22 | TPR | 927 4255 | 6244 | 0.050 | 0.6110 | No | ||
| 23 | NUP50 | 22403 9478 22402 2168 | 6397 | 0.046 | 0.6036 | No | ||
| 24 | IPO7 | 6130 | 6750 | 0.039 | 0.5853 | No | ||
| 25 | NUP153 | 21474 | 9748 | -0.003 | 0.4241 | No | ||
| 26 | C8A | 15823 | 9924 | -0.006 | 0.4148 | No | ||
| 27 | HRB | 14208 4066 | 14850 | -0.206 | 0.1531 | No | ||
| 28 | NUP54 | 11231 11232 6516 | 15341 | -0.320 | 0.1319 | No | ||
| 29 | SENP2 | 7990 | 15786 | -0.506 | 0.1161 | No | ||
| 30 | RANGAP1 | 2180 22195 | 15873 | -0.555 | 0.1205 | No | ||
| 31 | NXT1 | 14814 | 16018 | -0.676 | 0.1236 | No | ||
| 32 | KPNA1 | 22776 | 16344 | -0.998 | 0.1222 | No |

