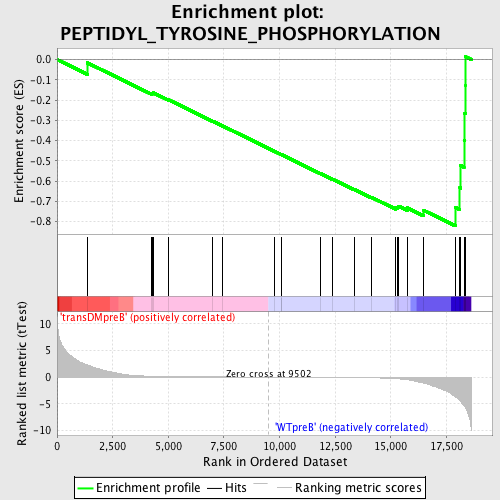
Profile of the Running ES Score & Positions of GeneSet Members on the Rank Ordered List
| Dataset | Set_04_transDMpreB_versus_WTpreB.phenotype_transDMpreB_versus_WTpreB.cls #transDMpreB_versus_WTpreB |
| Phenotype | phenotype_transDMpreB_versus_WTpreB.cls#transDMpreB_versus_WTpreB |
| Upregulated in class | WTpreB |
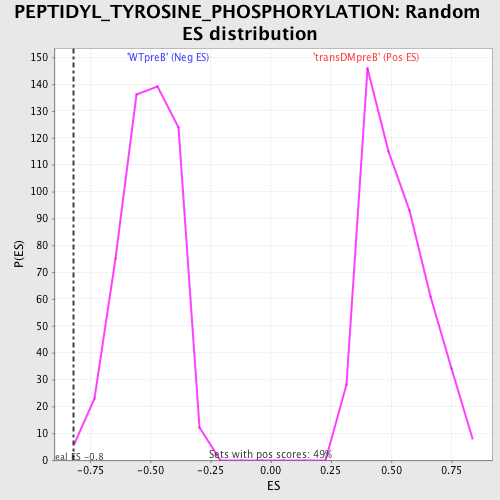
| GeneSet | PEPTIDYL_TYROSINE_PHOSPHORYLATION |
| Enrichment Score (ES) | -0.82104105 |
| Normalized Enrichment Score (NES) | -1.6233193 |
| Nominal p-value | 0.0019417476 |
| FDR q-value | 0.41220227 |
| FWER p-Value | 0.53 |
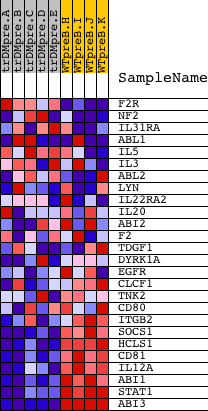
| PROBE | DESCRIPTION (from dataset) | GENE SYMBOL | GENE_TITLE | RANK IN GENE LIST | RANK METRIC SCORE | RUNNING ES | CORE ENRICHMENT | |
|---|---|---|---|---|---|---|---|---|
| 1 | F2R | 21386 | 1360 | 2.315 | -0.0160 | No | ||
| 2 | NF2 | 1222 5166 | 4260 | 0.157 | -0.1681 | No | ||
| 3 | IL31RA | 21347 | 4298 | 0.152 | -0.1663 | No | ||
| 4 | ABL1 | 2693 4301 2794 | 4314 | 0.151 | -0.1634 | No | ||
| 5 | IL5 | 20884 10220 | 5008 | 0.096 | -0.1983 | No | ||
| 6 | IL3 | 20453 | 6994 | 0.035 | -0.3042 | No | ||
| 7 | ABL2 | 8509 | 7445 | 0.027 | -0.3277 | No | ||
| 8 | LYN | 16281 | 9750 | -0.003 | -0.4516 | No | ||
| 9 | IL22RA2 | 20082 | 10072 | -0.008 | -0.4687 | No | ||
| 10 | IL20 | 13840 | 10097 | -0.008 | -0.4698 | No | ||
| 11 | ABI2 | 4037 6830 | 11852 | -0.033 | -0.5633 | No | ||
| 12 | F2 | 14524 | 12383 | -0.044 | -0.5907 | No | ||
| 13 | TDGF1 | 5704 10108 | 13359 | -0.075 | -0.6413 | No | ||
| 14 | DYRK1A | 4649 | 14123 | -0.120 | -0.6794 | No | ||
| 15 | EGFR | 1329 20944 | 15211 | -0.282 | -0.7309 | No | ||
| 16 | CLCF1 | 12160 3742 | 15289 | -0.306 | -0.7275 | No | ||
| 17 | TNK2 | 22784 | 15354 | -0.323 | -0.7229 | No | ||
| 18 | CD80 | 22758 | 15736 | -0.482 | -0.7315 | No | ||
| 19 | ITGB2 | 19978 | 16481 | -1.105 | -0.7443 | Yes | ||
| 20 | SOCS1 | 4522 | 17909 | -3.698 | -0.7298 | Yes | ||
| 21 | HCLS1 | 22770 | 18103 | -4.347 | -0.6328 | Yes | ||
| 22 | CD81 | 8719 | 18143 | -4.545 | -0.5228 | Yes | ||
| 23 | IL12A | 4913 | 18294 | -5.328 | -0.3993 | Yes | ||
| 24 | ABI1 | 4300 | 18324 | -5.473 | -0.2658 | Yes | ||
| 25 | STAT1 | 3936 5524 | 18359 | -5.675 | -0.1275 | Yes | ||
| 26 | ABI3 | 7314 | 18366 | -5.724 | 0.0134 | Yes |