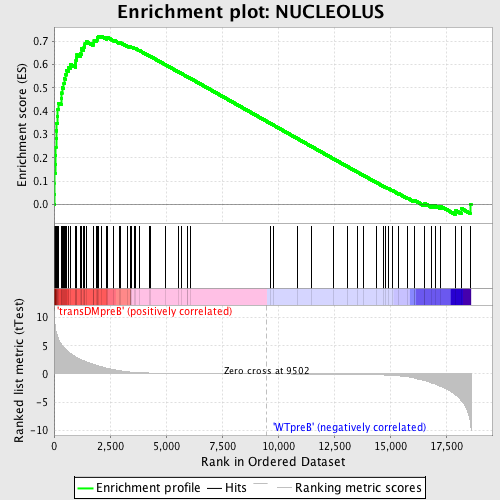
Profile of the Running ES Score & Positions of GeneSet Members on the Rank Ordered List
| Dataset | Set_04_transDMpreB_versus_WTpreB.phenotype_transDMpreB_versus_WTpreB.cls #transDMpreB_versus_WTpreB |
| Phenotype | phenotype_transDMpreB_versus_WTpreB.cls#transDMpreB_versus_WTpreB |
| Upregulated in class | transDMpreB |
| GeneSet | NUCLEOLUS |
| Enrichment Score (ES) | 0.72091734 |
| Normalized Enrichment Score (NES) | 1.7099265 |
| Nominal p-value | 0.0 |
| FDR q-value | 0.012236556 |
| FWER p-Value | 0.066 |
| PROBE | DESCRIPTION (from dataset) | GENE SYMBOL | GENE_TITLE | RANK IN GENE LIST | RANK METRIC SCORE | RUNNING ES | CORE ENRICHMENT | |
|---|---|---|---|---|---|---|---|---|
| 1 | NOL1 | 8472 17280 | 13 | 9.794 | 0.0456 | Yes | ||
| 2 | IKBKAP | 2540 6045 | 22 | 9.493 | 0.0901 | Yes | ||
| 3 | EXOSC1 | 12379 | 26 | 9.334 | 0.1342 | Yes | ||
| 4 | NOLA2 | 11972 | 48 | 8.405 | 0.1728 | Yes | ||
| 5 | CIRH1A | 18478 | 57 | 8.113 | 0.2108 | Yes | ||
| 6 | RRP9 | 19328 | 74 | 7.755 | 0.2466 | Yes | ||
| 7 | MYBBP1A | 5217 1232 5216 | 88 | 7.537 | 0.2816 | Yes | ||
| 8 | NOLA3 | 14914 | 98 | 7.365 | 0.3159 | Yes | ||
| 9 | SDAD1 | 16479 | 118 | 7.029 | 0.3482 | Yes | ||
| 10 | MKI67IP | 7509 | 151 | 6.621 | 0.3778 | Yes | ||
| 11 | RPP38 | 14698 | 166 | 6.514 | 0.4078 | Yes | ||
| 12 | PARP1 | 8559 14027 | 206 | 6.101 | 0.4346 | Yes | ||
| 13 | POLR1E | 7226 | 317 | 5.293 | 0.4537 | Yes | ||
| 14 | DDX21 | 19751 | 330 | 5.226 | 0.4778 | Yes | ||
| 15 | LYAR | 16856 | 355 | 5.078 | 0.5005 | Yes | ||
| 16 | NSUN2 | 21610 | 436 | 4.728 | 0.5186 | Yes | ||
| 17 | CDKN2A | 2491 15841 | 473 | 4.544 | 0.5382 | Yes | ||
| 18 | NOL5A | 12474 | 520 | 4.324 | 0.5561 | Yes | ||
| 19 | MORF4L2 | 12118 | 551 | 4.203 | 0.5744 | Yes | ||
| 20 | ELP3 | 21782 | 636 | 3.938 | 0.5885 | Yes | ||
| 21 | NOLC1 | 7704 | 728 | 3.609 | 0.6007 | Yes | ||
| 22 | MPHOSPH1 | 23878 | 961 | 2.997 | 0.6024 | Yes | ||
| 23 | TCOF1 | 5660 | 973 | 2.964 | 0.6158 | Yes | ||
| 24 | PTBP1 | 5303 | 996 | 2.908 | 0.6284 | Yes | ||
| 25 | RPP30 | 23877 | 1016 | 2.858 | 0.6409 | Yes | ||
| 26 | RPS19 | 5398 | 1168 | 2.594 | 0.6450 | Yes | ||
| 27 | NCL | 5153 13899 | 1212 | 2.514 | 0.6546 | Yes | ||
| 28 | TOP2A | 20257 | 1213 | 2.514 | 0.6665 | Yes | ||
| 29 | DDX11 | 23169 | 1331 | 2.347 | 0.6713 | Yes | ||
| 30 | GEMIN4 | 6592 6591 | 1345 | 2.333 | 0.6816 | Yes | ||
| 31 | COIL | 20708 | 1376 | 2.278 | 0.6908 | Yes | ||
| 32 | POP1 | 2214 7482 | 1437 | 2.166 | 0.6978 | Yes | ||
| 33 | SRP68 | 20143 | 1741 | 1.715 | 0.6895 | Yes | ||
| 34 | UBTF | 1313 10052 | 1778 | 1.664 | 0.6955 | Yes | ||
| 35 | ILF2 | 12582 | 1779 | 1.664 | 0.7033 | Yes | ||
| 36 | SLC29A2 | 23775 | 1910 | 1.527 | 0.7035 | Yes | ||
| 37 | KRR1 | 6989 3313 | 1918 | 1.518 | 0.7104 | Yes | ||
| 38 | SURF6 | 9945 | 1933 | 1.494 | 0.7167 | Yes | ||
| 39 | GNL3 | 21894 3356 | 1982 | 1.424 | 0.7208 | Yes | ||
| 40 | ASNA1 | 18810 | 2094 | 1.288 | 0.7209 | Yes | ||
| 41 | EMG1 | 1016 17005 | 2335 | 1.008 | 0.7127 | No | ||
| 42 | TOP1 | 5790 5789 10210 | 2370 | 0.996 | 0.7156 | No | ||
| 43 | POLR2A | 5394 | 2663 | 0.775 | 0.7035 | No | ||
| 44 | EXOSC10 | 2482 11943 | 2929 | 0.567 | 0.6919 | No | ||
| 45 | RPL3 | 11330 | 2971 | 0.546 | 0.6923 | No | ||
| 46 | POP7 | 16329 | 3265 | 0.384 | 0.6783 | No | ||
| 47 | DDX24 | 2084 20995 | 3392 | 0.333 | 0.6731 | No | ||
| 48 | RPL36 | 12024 | 3393 | 0.332 | 0.6746 | No | ||
| 49 | TOP2B | 5791 | 3422 | 0.324 | 0.6747 | No | ||
| 50 | TAF5 | 23833 5934 3759 | 3476 | 0.307 | 0.6733 | No | ||
| 51 | NOL6 | 2385 2405 15913 2466 | 3569 | 0.280 | 0.6696 | No | ||
| 52 | RBPJ | 9709 3594 5370 | 3623 | 0.267 | 0.6680 | No | ||
| 53 | RPP40 | 21491 | 3801 | 0.228 | 0.6595 | No | ||
| 54 | NF2 | 1222 5166 | 4260 | 0.157 | 0.6356 | No | ||
| 55 | ABL1 | 2693 4301 2794 | 4314 | 0.151 | 0.6334 | No | ||
| 56 | XRN2 | 2936 6302 2905 | 4981 | 0.098 | 0.5979 | No | ||
| 57 | MDM2 | 19620 3327 | 5550 | 0.070 | 0.5676 | No | ||
| 58 | NPM1 | 1196 | 5708 | 0.064 | 0.5595 | No | ||
| 59 | FMR1 | 24321 | 5955 | 0.057 | 0.5465 | No | ||
| 60 | IFI16 | 13745 | 5957 | 0.057 | 0.5467 | No | ||
| 61 | DDX56 | 6984 | 6102 | 0.053 | 0.5391 | No | ||
| 62 | POLA1 | 24112 | 9653 | -0.002 | 0.3476 | No | ||
| 63 | NLRP5 | 10743 18358 | 9799 | -0.004 | 0.3398 | No | ||
| 64 | WRN | 5882 10315 | 10865 | -0.018 | 0.2824 | No | ||
| 65 | EXOSC9 | 15610 | 11478 | -0.027 | 0.2495 | No | ||
| 66 | DNAJB9 | 6565 | 12450 | -0.046 | 0.1973 | No | ||
| 67 | NEK11 | 3099 19016 | 13101 | -0.065 | 0.1625 | No | ||
| 68 | MPHOSPH10 | 17805 | 13556 | -0.083 | 0.1384 | No | ||
| 69 | NOL4 | 2028 11432 | 13828 | -0.099 | 0.1243 | No | ||
| 70 | FGF18 | 4721 1351 | 14383 | -0.143 | 0.0951 | No | ||
| 71 | NUFIP1 | 21955 | 14707 | -0.185 | 0.0785 | No | ||
| 72 | NOL3 | 18496 915 921 | 14779 | -0.195 | 0.0756 | No | ||
| 73 | RPS7 | 9760 | 14916 | -0.220 | 0.0693 | No | ||
| 74 | PML | 3015 3074 3020 5270 | 15104 | -0.259 | 0.0604 | No | ||
| 75 | CCNT1 | 22140 11607 | 15392 | -0.339 | 0.0466 | No | ||
| 76 | RPL35 | 12360 | 15773 | -0.498 | 0.0284 | No | ||
| 77 | DEDD | 14056 | 16078 | -0.728 | 0.0154 | No | ||
| 78 | RPL11 | 12450 | 16091 | -0.736 | 0.0183 | No | ||
| 79 | ZNF346 | 3163 6517 3193 | 16532 | -1.153 | -0.0000 | No | ||
| 80 | APTX | 2455 7291 | 16548 | -1.170 | 0.0047 | No | ||
| 81 | DDX47 | 17261 12577 1133 | 16860 | -1.607 | -0.0045 | No | ||
| 82 | KLHL7 | 16907 | 17012 | -1.798 | -0.0041 | No | ||
| 83 | SMUG1 | 22109 | 17243 | -2.207 | -0.0061 | No | ||
| 84 | DDX54 | 7778 | 17908 | -3.698 | -0.0244 | No | ||
| 85 | DEDD2 | 7429 | 18192 | -4.825 | -0.0168 | No | ||
| 86 | TP53 | 20822 | 18572 | -8.381 | 0.0024 | No |

