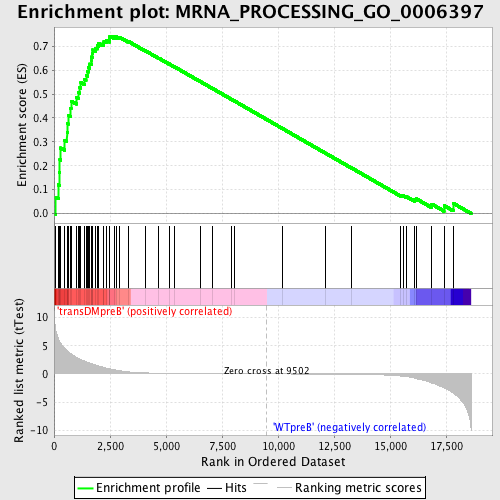
Profile of the Running ES Score & Positions of GeneSet Members on the Rank Ordered List
| Dataset | Set_04_transDMpreB_versus_WTpreB.phenotype_transDMpreB_versus_WTpreB.cls #transDMpreB_versus_WTpreB |
| Phenotype | phenotype_transDMpreB_versus_WTpreB.cls#transDMpreB_versus_WTpreB |
| Upregulated in class | transDMpreB |
| GeneSet | MRNA_PROCESSING_GO_0006397 |
| Enrichment Score (ES) | 0.74263316 |
| Normalized Enrichment Score (NES) | 1.6429394 |
| Nominal p-value | 0.0 |
| FDR q-value | 0.020624744 |
| FWER p-Value | 0.327 |
| PROBE | DESCRIPTION (from dataset) | GENE SYMBOL | GENE_TITLE | RANK IN GENE LIST | RANK METRIC SCORE | RUNNING ES | CORE ENRICHMENT | |
|---|---|---|---|---|---|---|---|---|
| 1 | SRPK1 | 23049 | 72 | 7.805 | 0.0688 | Yes | ||
| 2 | SNRPD1 | 23622 | 192 | 6.236 | 0.1205 | Yes | ||
| 3 | CPSF1 | 22241 | 231 | 5.884 | 0.1732 | Yes | ||
| 4 | SFRS6 | 14751 | 257 | 5.683 | 0.2248 | Yes | ||
| 5 | EFTUD2 | 1219 20203 | 290 | 5.524 | 0.2746 | Yes | ||
| 6 | SF3B3 | 18746 | 478 | 4.530 | 0.3067 | Yes | ||
| 7 | SNRPD2 | 8412 | 575 | 4.118 | 0.3399 | Yes | ||
| 8 | SF3A3 | 16091 | 608 | 4.011 | 0.3755 | Yes | ||
| 9 | PHF5A | 22194 | 627 | 3.958 | 0.4114 | Yes | ||
| 10 | GEMIN5 | 20439 | 733 | 3.602 | 0.4393 | Yes | ||
| 11 | CDC2L2 | 15964 2419 | 760 | 3.548 | 0.4709 | Yes | ||
| 12 | PTBP1 | 5303 | 996 | 2.908 | 0.4854 | Yes | ||
| 13 | SIP1 | 21263 | 1083 | 2.751 | 0.5063 | Yes | ||
| 14 | DDX39 | 18551 | 1147 | 2.643 | 0.5276 | Yes | ||
| 15 | GRSF1 | 16487 | 1194 | 2.542 | 0.5488 | Yes | ||
| 16 | CSTF1 | 12515 | 1365 | 2.310 | 0.5611 | Yes | ||
| 17 | SF3A1 | 7450 | 1425 | 2.194 | 0.5784 | Yes | ||
| 18 | DHX38 | 48 | 1498 | 2.058 | 0.5937 | Yes | ||
| 19 | DDX20 | 15213 | 1524 | 2.019 | 0.6111 | Yes | ||
| 20 | SFRS5 | 9808 2062 | 1583 | 1.930 | 0.6260 | Yes | ||
| 21 | LSM3 | 12565 | 1660 | 1.823 | 0.6389 | Yes | ||
| 22 | CSTF2 | 24257 | 1668 | 1.816 | 0.6554 | Yes | ||
| 23 | USP39 | 1116 1083 11373 | 1701 | 1.767 | 0.6701 | Yes | ||
| 24 | RNMT | 7501 | 1731 | 1.736 | 0.6847 | Yes | ||
| 25 | SFRS1 | 8492 | 1857 | 1.596 | 0.6929 | Yes | ||
| 26 | DHX15 | 8842 | 1936 | 1.484 | 0.7025 | Yes | ||
| 27 | SFRS9 | 16731 | 1989 | 1.418 | 0.7129 | Yes | ||
| 28 | SFPQ | 12936 | 2197 | 1.158 | 0.7125 | Yes | ||
| 29 | SFRS2 | 9807 20136 | 2224 | 1.131 | 0.7217 | Yes | ||
| 30 | FUSIP1 | 4715 16036 | 2330 | 1.013 | 0.7254 | Yes | ||
| 31 | NONO | 11993 | 2473 | 0.919 | 0.7263 | Yes | ||
| 32 | SFRS2IP | 7794 13009 | 2477 | 0.912 | 0.7347 | Yes | ||
| 33 | NUDT21 | 12665 | 2487 | 0.906 | 0.7426 | Yes | ||
| 34 | PRPF31 | 7594 | 2674 | 0.769 | 0.7398 | No | ||
| 35 | SFRS7 | 22889 | 2779 | 0.674 | 0.7404 | No | ||
| 36 | SF3A2 | 19938 | 2930 | 0.566 | 0.7376 | No | ||
| 37 | CSTF3 | 10449 6002 | 3299 | 0.374 | 0.7213 | No | ||
| 38 | KIN | 15120 | 4062 | 0.181 | 0.6819 | No | ||
| 39 | CPSF3 | 7038 | 4663 | 0.118 | 0.6507 | No | ||
| 40 | CUGBP1 | 2805 8819 4576 2924 | 5128 | 0.089 | 0.6265 | No | ||
| 41 | ELAVL4 | 15805 4889 9137 | 5370 | 0.077 | 0.6143 | No | ||
| 42 | SPOP | 5498 | 6523 | 0.044 | 0.5526 | No | ||
| 43 | SLBP | 9822 | 7052 | 0.034 | 0.5245 | No | ||
| 44 | PABPC1 | 5219 9522 9523 23572 | 7921 | 0.021 | 0.4779 | No | ||
| 45 | SFRS10 | 9818 1722 5441 | 8049 | 0.019 | 0.4712 | No | ||
| 46 | GEMIN6 | 12492 7415 | 10191 | -0.009 | 0.3560 | No | ||
| 47 | SNW1 | 7282 | 12119 | -0.038 | 0.2525 | No | ||
| 48 | LSM5 | 7286 | 13262 | -0.070 | 0.1916 | No | ||
| 49 | RNGTT | 10769 2354 6272 | 15476 | -0.370 | 0.0759 | No | ||
| 50 | SFRS8 | 10543 6089 | 15575 | -0.413 | 0.0744 | No | ||
| 51 | KHDRBS1 | 5405 9778 | 15739 | -0.484 | 0.0702 | No | ||
| 52 | PPARGC1A | 16533 | 16090 | -0.735 | 0.0581 | No | ||
| 53 | SRPK2 | 5513 | 16172 | -0.834 | 0.0615 | No | ||
| 54 | TXNL4A | 6567 11329 | 16855 | -1.602 | 0.0397 | No | ||
| 55 | CRNKL1 | 14407 | 17407 | -2.495 | 0.0333 | No | ||
| 56 | GEMIN7 | 17944 | 17816 | -3.414 | 0.0431 | No |

