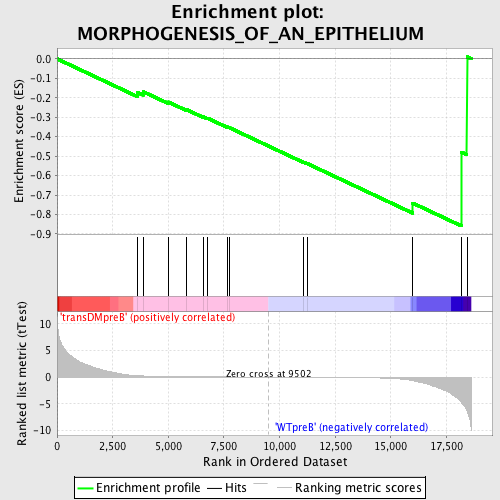
Profile of the Running ES Score & Positions of GeneSet Members on the Rank Ordered List
| Dataset | Set_04_transDMpreB_versus_WTpreB.phenotype_transDMpreB_versus_WTpreB.cls #transDMpreB_versus_WTpreB |
| Phenotype | phenotype_transDMpreB_versus_WTpreB.cls#transDMpreB_versus_WTpreB |
| Upregulated in class | WTpreB |
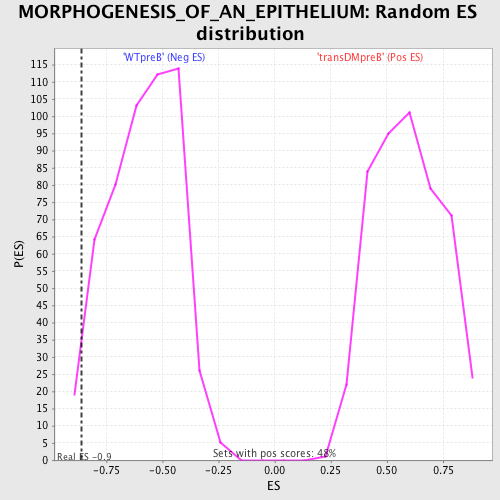
| GeneSet | MORPHOGENESIS_OF_AN_EPITHELIUM |
| Enrichment Score (ES) | -0.8587976 |
| Normalized Enrichment Score (NES) | -1.475009 |
| Nominal p-value | 0.019120459 |
| FDR q-value | 0.62425905 |
| FWER p-Value | 1.0 |
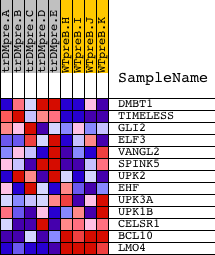
| PROBE | DESCRIPTION (from dataset) | GENE SYMBOL | GENE_TITLE | RANK IN GENE LIST | RANK METRIC SCORE | RUNNING ES | CORE ENRICHMENT | |
|---|---|---|---|---|---|---|---|---|
| 1 | DMBT1 | 18050 | 3609 | 0.270 | -0.1723 | No | ||
| 2 | TIMELESS | 10177 | 3865 | 0.216 | -0.1686 | No | ||
| 3 | GLI2 | 13859 | 4996 | 0.097 | -0.2216 | No | ||
| 4 | ELF3 | 8894 13824 | 5799 | 0.061 | -0.2598 | No | ||
| 5 | VANGL2 | 4109 8220 | 6558 | 0.043 | -0.2971 | No | ||
| 6 | SPINK5 | 23569 | 6759 | 0.039 | -0.3047 | No | ||
| 7 | UPK2 | 19146 | 7637 | 0.025 | -0.3499 | No | ||
| 8 | EHF | 4657 | 7731 | 0.023 | -0.3530 | No | ||
| 9 | UPK3A | 22401 | 11090 | -0.021 | -0.5318 | No | ||
| 10 | UPK1B | 22592 | 11246 | -0.023 | -0.5383 | No | ||
| 11 | CELSR1 | 8735 | 15979 | -0.643 | -0.7409 | Yes | ||
| 12 | BCL10 | 15397 | 18173 | -4.717 | -0.4797 | Yes | ||
| 13 | LMO4 | 15151 | 18424 | -6.264 | 0.0103 | Yes |