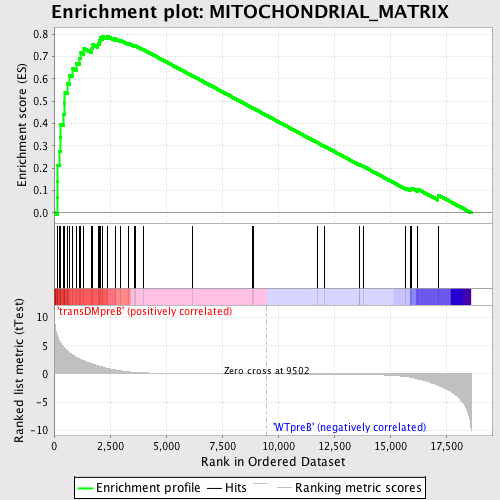
Profile of the Running ES Score & Positions of GeneSet Members on the Rank Ordered List
| Dataset | Set_04_transDMpreB_versus_WTpreB.phenotype_transDMpreB_versus_WTpreB.cls #transDMpreB_versus_WTpreB |
| Phenotype | phenotype_transDMpreB_versus_WTpreB.cls#transDMpreB_versus_WTpreB |
| Upregulated in class | transDMpreB |
| GeneSet | MITOCHONDRIAL_MATRIX |
| Enrichment Score (ES) | 0.79216486 |
| Normalized Enrichment Score (NES) | 1.7036 |
| Nominal p-value | 0.001992032 |
| FDR q-value | 0.009114661 |
| FWER p-Value | 0.077 |
| PROBE | DESCRIPTION (from dataset) | GENE SYMBOL | GENE_TITLE | RANK IN GENE LIST | RANK METRIC SCORE | RUNNING ES | CORE ENRICHMENT | |
|---|---|---|---|---|---|---|---|---|
| 1 | MRPL12 | 12090 | 140 | 6.728 | 0.0675 | Yes | ||
| 2 | BCKDHB | 19365 | 148 | 6.666 | 0.1414 | Yes | ||
| 3 | MRPS15 | 2442 12345 | 162 | 6.562 | 0.2139 | Yes | ||
| 4 | MRPS12 | 17907 6273 | 227 | 5.908 | 0.2763 | Yes | ||
| 5 | MRPS18A | 23222 | 270 | 5.610 | 0.3366 | Yes | ||
| 6 | SUPV3L1 | 11677 | 288 | 5.545 | 0.3975 | Yes | ||
| 7 | PIN4 | 12817 | 431 | 4.753 | 0.4428 | Yes | ||
| 8 | MRPL55 | 20864 | 476 | 4.531 | 0.4910 | Yes | ||
| 9 | MRPL23 | 9738 | 485 | 4.505 | 0.5408 | Yes | ||
| 10 | TIMM44 | 3858 18941 | 600 | 4.030 | 0.5796 | Yes | ||
| 11 | MRPS28 | 15377 | 685 | 3.766 | 0.6170 | Yes | ||
| 12 | ALDH4A1 | 16011 | 805 | 3.422 | 0.6488 | Yes | ||
| 13 | MRPL40 | 22641 | 993 | 2.919 | 0.6712 | Yes | ||
| 14 | ETFB | 18279 | 1151 | 2.632 | 0.6921 | Yes | ||
| 15 | ETFA | 4292 8495 3155 | 1196 | 2.537 | 0.7180 | Yes | ||
| 16 | POLG2 | 20180 | 1333 | 2.345 | 0.7369 | Yes | ||
| 17 | MRPS18C | 12728 | 1688 | 1.784 | 0.7377 | Yes | ||
| 18 | ACADM | 15133 1800 | 1717 | 1.745 | 0.7556 | Yes | ||
| 19 | MRPL10 | 20681 | 1959 | 1.449 | 0.7588 | Yes | ||
| 20 | MRPS24 | 12262 | 2021 | 1.373 | 0.7708 | Yes | ||
| 21 | MRPL51 | 12361 7301 | 2051 | 1.331 | 0.7841 | Yes | ||
| 22 | MRPS11 | 12621 3150 | 2153 | 1.208 | 0.7922 | Yes | ||
| 23 | MRPS10 | 7229 12261 23212 | 2375 | 0.995 | 0.7914 | No | ||
| 24 | NDUFAB1 | 7667 | 2732 | 0.718 | 0.7802 | No | ||
| 25 | MRPS16 | 12311 | 2973 | 0.544 | 0.7733 | No | ||
| 26 | DNAJA3 | 1732 13518 | 3327 | 0.362 | 0.7584 | No | ||
| 27 | MRPS21 | 12323 | 3574 | 0.279 | 0.7482 | No | ||
| 28 | NFS1 | 2903 14377 | 3613 | 0.269 | 0.7492 | No | ||
| 29 | DBT | 1770 4599 | 3972 | 0.198 | 0.7321 | No | ||
| 30 | ATP5F1 | 15212 | 6180 | 0.052 | 0.6139 | No | ||
| 31 | PITRM1 | 21710 | 8876 | 0.008 | 0.4689 | No | ||
| 32 | MRPS22 | 19031 | 8918 | 0.007 | 0.4668 | No | ||
| 33 | MRPS36 | 7257 | 11763 | -0.032 | 0.3140 | No | ||
| 34 | GRPEL1 | 16863 | 12074 | -0.037 | 0.2977 | No | ||
| 35 | BCKDK | 18061 1391 | 13653 | -0.089 | 0.2138 | No | ||
| 36 | CS | 19839 | 13654 | -0.089 | 0.2148 | No | ||
| 37 | CASQ1 | 13752 8695 | 13810 | -0.098 | 0.2075 | No | ||
| 38 | TFB2M | 4024 9092 4083 | 15704 | -0.464 | 0.1108 | No | ||
| 39 | NR3C1 | 9043 | 15913 | -0.586 | 0.1061 | No | ||
| 40 | MRPL52 | 22019 | 15950 | -0.610 | 0.1110 | No | ||
| 41 | MRPS35 | 17237 1068 | 16237 | -0.901 | 0.1056 | No | ||
| 42 | BCKDHA | 17925 | 17137 | -2.010 | 0.0796 | No |

