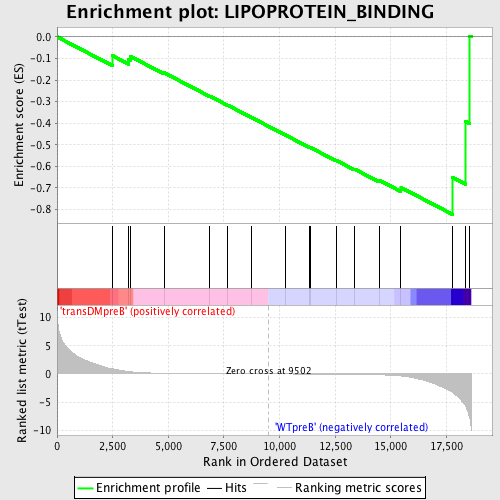
Profile of the Running ES Score & Positions of GeneSet Members on the Rank Ordered List
| Dataset | Set_04_transDMpreB_versus_WTpreB.phenotype_transDMpreB_versus_WTpreB.cls #transDMpreB_versus_WTpreB |
| Phenotype | phenotype_transDMpreB_versus_WTpreB.cls#transDMpreB_versus_WTpreB |
| Upregulated in class | WTpreB |
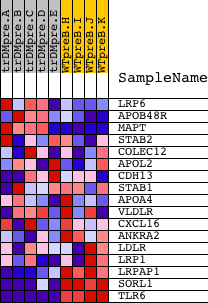
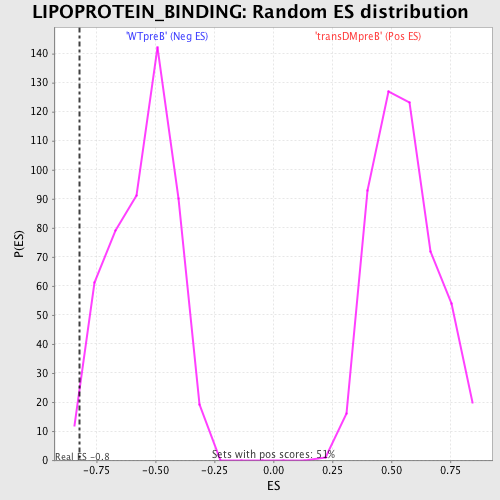
| GeneSet | LIPOPROTEIN_BINDING |
| Enrichment Score (ES) | -0.8231207 |
| Normalized Enrichment Score (NES) | -1.4868234 |
| Nominal p-value | 0.012145749 |
| FDR q-value | 0.78893507 |
| FWER p-Value | 0.998 |
| PROBE | DESCRIPTION (from dataset) | GENE SYMBOL | GENE_TITLE | RANK IN GENE LIST | RANK METRIC SCORE | RUNNING ES | CORE ENRICHMENT | |
|---|---|---|---|---|---|---|---|---|
| 1 | LRP6 | 9286 | 2491 | 0.904 | -0.0872 | No | ||
| 2 | APOB48R | 18081 | 3217 | 0.403 | -0.1053 | No | ||
| 3 | MAPT | 9420 1347 | 3311 | 0.367 | -0.0913 | No | ||
| 4 | STAB2 | 19656 | 4806 | 0.109 | -0.1660 | No | ||
| 5 | COLEC12 | 23624 8946 | 6859 | 0.037 | -0.2744 | No | ||
| 6 | APOL2 | 22229 | 7672 | 0.024 | -0.3168 | No | ||
| 7 | CDH13 | 4506 3826 | 8740 | 0.009 | -0.3737 | No | ||
| 8 | STAB1 | 21892 | 10249 | -0.010 | -0.4543 | No | ||
| 9 | APOA4 | 4401 | 11350 | -0.025 | -0.5121 | No | ||
| 10 | VLDLR | 5858 3763 912 3682 | 11375 | -0.025 | -0.5121 | No | ||
| 11 | CXCL16 | 7251 | 12546 | -0.049 | -0.5725 | No | ||
| 12 | ANKRA2 | 21578 | 13372 | -0.075 | -0.6130 | No | ||
| 13 | LDLR | 4990 | 14468 | -0.153 | -0.6639 | No | ||
| 14 | LRP1 | 9284 | 15456 | -0.363 | -0.6982 | Yes | ||
| 15 | LRPAP1 | 5005 | 17780 | -3.310 | -0.6519 | Yes | ||
| 16 | SORL1 | 5474 | 18351 | -5.626 | -0.3916 | Yes | ||
| 17 | TLR6 | 215 16528 | 18550 | -7.847 | 0.0035 | Yes |