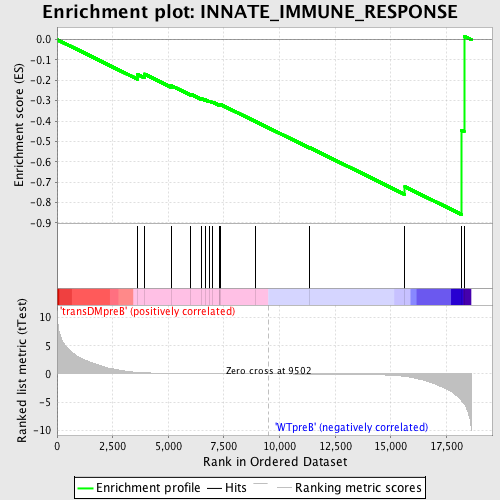
Profile of the Running ES Score & Positions of GeneSet Members on the Rank Ordered List
| Dataset | Set_04_transDMpreB_versus_WTpreB.phenotype_transDMpreB_versus_WTpreB.cls #transDMpreB_versus_WTpreB |
| Phenotype | phenotype_transDMpreB_versus_WTpreB.cls#transDMpreB_versus_WTpreB |
| Upregulated in class | WTpreB |
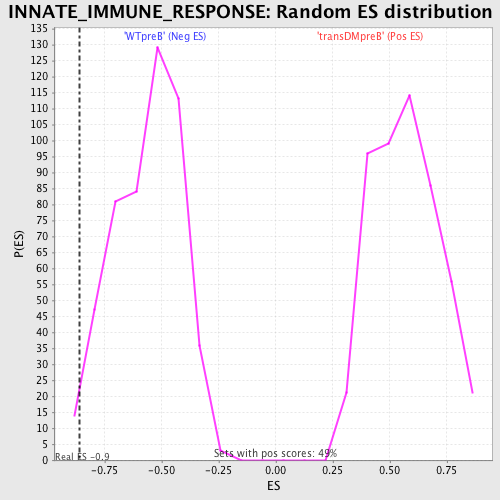
| GeneSet | INNATE_IMMUNE_RESPONSE |
| Enrichment Score (ES) | -0.8590878 |
| Normalized Enrichment Score (NES) | -1.5253217 |
| Nominal p-value | 0.009861933 |
| FDR q-value | 1.0 |
| FWER p-Value | 0.99 |
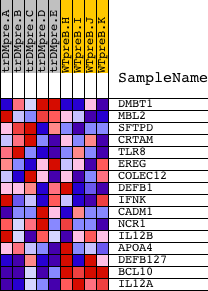
| PROBE | DESCRIPTION (from dataset) | GENE SYMBOL | GENE_TITLE | RANK IN GENE LIST | RANK METRIC SCORE | RUNNING ES | CORE ENRICHMENT | |
|---|---|---|---|---|---|---|---|---|
| 1 | DMBT1 | 18050 | 3609 | 0.270 | -0.1703 | No | ||
| 2 | MBL2 | 23886 | 3920 | 0.207 | -0.1688 | No | ||
| 3 | SFTPD | 21867 | 5147 | 0.088 | -0.2270 | No | ||
| 4 | CRTAM | 19160 | 6000 | 0.056 | -0.2679 | No | ||
| 5 | TLR8 | 9308 | 6497 | 0.044 | -0.2906 | No | ||
| 6 | EREG | 4679 16797 | 6648 | 0.041 | -0.2951 | No | ||
| 7 | COLEC12 | 23624 8946 | 6859 | 0.037 | -0.3031 | No | ||
| 8 | DEFB1 | 18663 | 6980 | 0.035 | -0.3065 | No | ||
| 9 | IFNK | 11837 | 7302 | 0.030 | -0.3211 | No | ||
| 10 | CADM1 | 7057 | 7304 | 0.030 | -0.3186 | No | ||
| 11 | NCR1 | 18409 | 7362 | 0.028 | -0.3191 | No | ||
| 12 | IL12B | 20918 | 8911 | 0.007 | -0.4017 | No | ||
| 13 | APOA4 | 4401 | 11350 | -0.025 | -0.5306 | No | ||
| 14 | DEFB127 | 622 | 15633 | -0.435 | -0.7226 | Yes | ||
| 15 | BCL10 | 15397 | 18173 | -4.717 | -0.4445 | Yes | ||
| 16 | IL12A | 4913 | 18294 | -5.328 | 0.0173 | Yes |