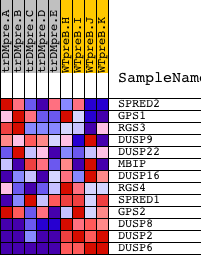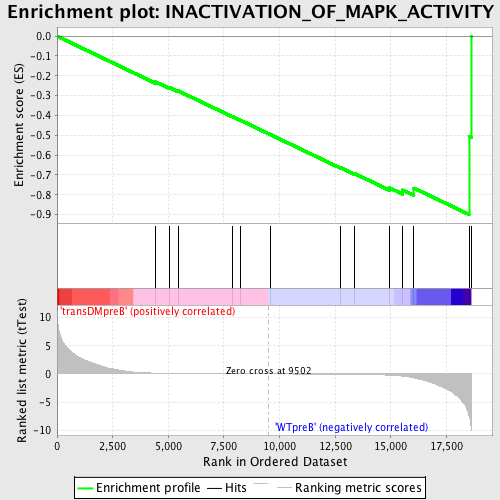
Profile of the Running ES Score & Positions of GeneSet Members on the Rank Ordered List
| Dataset | Set_04_transDMpreB_versus_WTpreB.phenotype_transDMpreB_versus_WTpreB.cls #transDMpreB_versus_WTpreB |
| Phenotype | phenotype_transDMpreB_versus_WTpreB.cls#transDMpreB_versus_WTpreB |
| Upregulated in class | WTpreB |
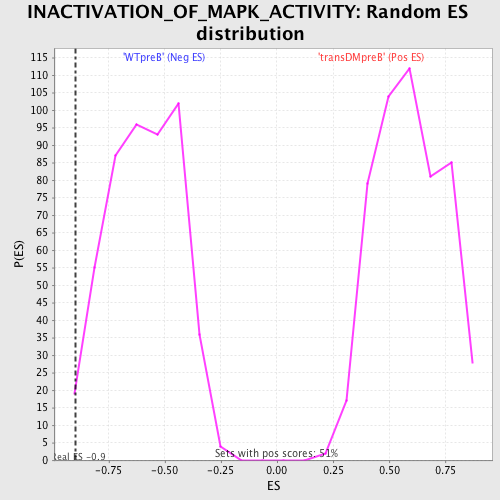
| GeneSet | INACTIVATION_OF_MAPK_ACTIVITY |
| Enrichment Score (ES) | -0.8995189 |
| Normalized Enrichment Score (NES) | -1.5167276 |
| Nominal p-value | 0.008130081 |
| FDR q-value | 0.8669879 |
| FWER p-Value | 0.994 |
| PROBE | DESCRIPTION (from dataset) | GENE SYMBOL | GENE_TITLE | RANK IN GENE LIST | RANK METRIC SCORE | RUNNING ES | CORE ENRICHMENT | |
|---|---|---|---|---|---|---|---|---|
| 1 | SPRED2 | 8539 4332 | 4420 | 0.139 | -0.2301 | No | ||
| 2 | GPS1 | 1392 9943 5550 9944 | 5064 | 0.093 | -0.2598 | No | ||
| 3 | RGS3 | 2434 2474 6937 11935 2374 2332 2445 2390 | 5441 | 0.075 | -0.2760 | No | ||
| 4 | DUSP9 | 24307 | 7863 | 0.021 | -0.4050 | No | ||
| 5 | DUSP22 | 466 21680 | 8256 | 0.016 | -0.4252 | No | ||
| 6 | MBIP | 21063 2072 | 9602 | -0.002 | -0.4974 | No | ||
| 7 | DUSP16 | 1004 7699 | 12741 | -0.054 | -0.6632 | No | ||
| 8 | RGS4 | 9724 | 13360 | -0.075 | -0.6924 | No | ||
| 9 | SPRED1 | 4331 | 14947 | -0.225 | -0.7657 | No | ||
| 10 | GPS2 | 12096 | 15533 | -0.395 | -0.7760 | Yes | ||
| 11 | DUSP8 | 9493 | 16035 | -0.686 | -0.7663 | Yes | ||
| 12 | DUSP2 | 14865 | 18515 | -7.372 | -0.5058 | Yes | ||
| 13 | DUSP6 | 19891 3399 | 18611 | -9.573 | 0.0003 | Yes |