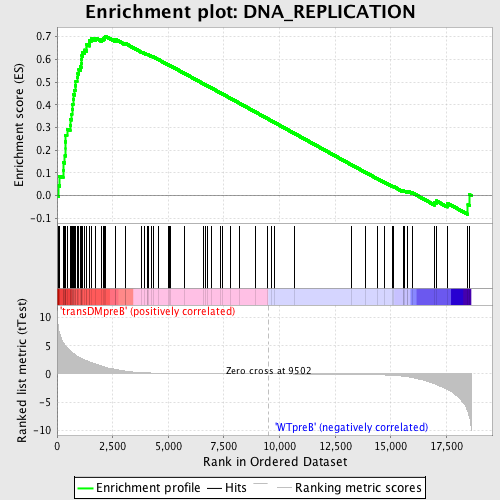
Profile of the Running ES Score & Positions of GeneSet Members on the Rank Ordered List
| Dataset | Set_04_transDMpreB_versus_WTpreB.phenotype_transDMpreB_versus_WTpreB.cls #transDMpreB_versus_WTpreB |
| Phenotype | phenotype_transDMpreB_versus_WTpreB.cls#transDMpreB_versus_WTpreB |
| Upregulated in class | transDMpreB |
| GeneSet | DNA_REPLICATION |
| Enrichment Score (ES) | 0.702203 |
| Normalized Enrichment Score (NES) | 1.690247 |
| Nominal p-value | 0.0018832391 |
| FDR q-value | 0.009931111 |
| FWER p-Value | 0.115 |
| PROBE | DESCRIPTION (from dataset) | GENE SYMBOL | GENE_TITLE | RANK IN GENE LIST | RANK METRIC SCORE | RUNNING ES | CORE ENRICHMENT | |
|---|---|---|---|---|---|---|---|---|
| 1 | POLD2 | 20537 | 78 | 7.693 | 0.0438 | Yes | ||
| 2 | POLE | 16755 | 111 | 7.095 | 0.0864 | Yes | ||
| 3 | ATR | 19349 | 268 | 5.616 | 0.1131 | Yes | ||
| 4 | POLE3 | 7200 | 276 | 5.588 | 0.1476 | Yes | ||
| 5 | MLH1 | 18982 | 353 | 5.103 | 0.1753 | Yes | ||
| 6 | GTPBP4 | 21548 | 370 | 4.995 | 0.2057 | Yes | ||
| 7 | MCM3 | 13991 | 372 | 4.986 | 0.2368 | Yes | ||
| 8 | TIPIN | 3013 7258 | 386 | 4.919 | 0.2668 | Yes | ||
| 9 | MCM2 | 17074 | 445 | 4.703 | 0.2930 | Yes | ||
| 10 | MSH2 | 23138 | 583 | 4.074 | 0.3111 | Yes | ||
| 11 | REV1 | 13971 | 595 | 4.054 | 0.3358 | Yes | ||
| 12 | RPA1 | 20349 | 648 | 3.903 | 0.3574 | Yes | ||
| 13 | RFC4 | 1735 22627 | 670 | 3.827 | 0.3801 | Yes | ||
| 14 | RFC1 | 16527 | 696 | 3.717 | 0.4020 | Yes | ||
| 15 | PRIM1 | 19847 | 719 | 3.648 | 0.4236 | Yes | ||
| 16 | GMNN | 21513 | 749 | 3.568 | 0.4443 | Yes | ||
| 17 | NT5M | 8345 4175 | 778 | 3.508 | 0.4647 | Yes | ||
| 18 | RNASEH2A | 12819 | 813 | 3.399 | 0.4841 | Yes | ||
| 19 | MCM5 | 18564 | 842 | 3.327 | 0.5033 | Yes | ||
| 20 | RPA2 | 2330 16057 | 895 | 3.168 | 0.5203 | Yes | ||
| 21 | RPA3 | 12667 | 932 | 3.065 | 0.5375 | Yes | ||
| 22 | KCTD13 | 10609 | 977 | 2.952 | 0.5536 | Yes | ||
| 23 | UPF1 | 9718 18855 | 1051 | 2.802 | 0.5671 | Yes | ||
| 24 | CDT1 | 18437 | 1080 | 2.756 | 0.5828 | Yes | ||
| 25 | MRE11A | 3014 19560 | 1098 | 2.727 | 0.5989 | Yes | ||
| 26 | MSH6 | 23137 5120 | 1112 | 2.697 | 0.6151 | Yes | ||
| 27 | PMS2 | 16632 | 1148 | 2.641 | 0.6297 | Yes | ||
| 28 | NASP | 2383 2387 6955 | 1225 | 2.494 | 0.6412 | Yes | ||
| 29 | CDK2AP1 | 8858 | 1332 | 2.346 | 0.6501 | Yes | ||
| 30 | POLG2 | 20180 | 1333 | 2.345 | 0.6647 | Yes | ||
| 31 | CDK2 | 3438 3373 19592 3322 | 1447 | 2.143 | 0.6720 | Yes | ||
| 32 | S100A11 | 9771 | 1459 | 2.125 | 0.6847 | Yes | ||
| 33 | MCM7 | 9372 3568 | 1539 | 1.995 | 0.6929 | Yes | ||
| 34 | ORC5L | 11173 3595 | 1726 | 1.738 | 0.6937 | Yes | ||
| 35 | REV3L | 20050 | 2002 | 1.401 | 0.6876 | Yes | ||
| 36 | RFC3 | 12786 | 2067 | 1.318 | 0.6924 | Yes | ||
| 37 | MUTYH | 2400 7693 | 2132 | 1.233 | 0.6967 | Yes | ||
| 38 | TERF2 | 18756 | 2168 | 1.191 | 0.7022 | Yes | ||
| 39 | MSH3 | 5119 | 2616 | 0.814 | 0.6832 | No | ||
| 40 | RBMS1 | 14580 | 2627 | 0.804 | 0.6876 | No | ||
| 41 | EGF | 15169 | 3071 | 0.478 | 0.6667 | No | ||
| 42 | MYST2 | 20283 | 3088 | 0.470 | 0.6688 | No | ||
| 43 | NAP1L1 | 19882 3427 330 9485 5193 | 3802 | 0.228 | 0.6318 | No | ||
| 44 | TERF2IP | 12184 18463 7167 | 3909 | 0.208 | 0.6273 | No | ||
| 45 | KIN | 15120 | 4062 | 0.181 | 0.6203 | No | ||
| 46 | CDC6 | 6221 6220 | 4074 | 0.180 | 0.6208 | No | ||
| 47 | PMS1 | 13958 | 4098 | 0.176 | 0.6207 | No | ||
| 48 | NF2 | 1222 5166 | 4260 | 0.157 | 0.6129 | No | ||
| 49 | ABL1 | 2693 4301 2794 | 4314 | 0.151 | 0.6110 | No | ||
| 50 | ORC4L | 11172 6460 | 4571 | 0.126 | 0.5980 | No | ||
| 51 | GLI2 | 13859 | 4996 | 0.097 | 0.5757 | No | ||
| 52 | RAD51 | 2897 14903 | 5044 | 0.094 | 0.5738 | No | ||
| 53 | NBN | 2485 16268 2408 | 5101 | 0.090 | 0.5713 | No | ||
| 54 | NUP98 | 17726 | 5721 | 0.064 | 0.5383 | No | ||
| 55 | CDC45L | 22642 1752 | 6568 | 0.043 | 0.4929 | No | ||
| 56 | EREG | 4679 16797 | 6648 | 0.041 | 0.4889 | No | ||
| 57 | SET | 7070 | 6742 | 0.039 | 0.4842 | No | ||
| 58 | TFAM | 19739 3330 | 6922 | 0.036 | 0.4747 | No | ||
| 59 | MCM3AP | 19981 | 7341 | 0.029 | 0.4523 | No | ||
| 60 | POT1 | 17201 | 7423 | 0.028 | 0.4482 | No | ||
| 61 | POLE2 | 21053 | 7814 | 0.022 | 0.4272 | No | ||
| 62 | HMGB2 | 13594 | 8194 | 0.017 | 0.4069 | No | ||
| 63 | IGF1 | 3352 9156 3409 | 8900 | 0.008 | 0.3689 | No | ||
| 64 | GLI1 | 19605 | 9456 | 0.001 | 0.3390 | No | ||
| 65 | POLA1 | 24112 | 9653 | -0.002 | 0.3284 | No | ||
| 66 | ACHE | 16665 | 9761 | -0.003 | 0.3227 | No | ||
| 67 | PURA | 9670 | 10677 | -0.015 | 0.2734 | No | ||
| 68 | WRNIP1 | 21675 3161 | 13226 | -0.069 | 0.1363 | No | ||
| 69 | IGHMBP2 | 23945 | 13847 | -0.100 | 0.1035 | No | ||
| 70 | TINF2 | 11381 | 14398 | -0.145 | 0.0747 | No | ||
| 71 | RAD9A | 913 3674 910 23958 | 14697 | -0.184 | 0.0598 | No | ||
| 72 | ORC2L | 385 13949 | 15082 | -0.255 | 0.0407 | No | ||
| 73 | EXO1 | 14035 4135 | 15128 | -0.263 | 0.0399 | No | ||
| 74 | RAD50 | 1198 20460 | 15558 | -0.406 | 0.0193 | No | ||
| 75 | RAD17 | 21366 | 15569 | -0.410 | 0.0213 | No | ||
| 76 | MSH5 | 23010 1599 | 15631 | -0.435 | 0.0207 | No | ||
| 77 | ORC3L | 6941 | 15735 | -0.482 | 0.0182 | No | ||
| 78 | ORC1L | 327 16144 | 15769 | -0.497 | 0.0195 | No | ||
| 79 | TBRG1 | 3119 19174 | 15954 | -0.616 | 0.0134 | No | ||
| 80 | REPIN1 | 12220 | 16967 | -1.734 | -0.0304 | No | ||
| 81 | POLD1 | 17847 | 17042 | -1.851 | -0.0228 | No | ||
| 82 | POLB | 9599 | 17541 | -2.711 | -0.0328 | No | ||
| 83 | POLD4 | 12822 | 18466 | -6.742 | -0.0405 | No | ||
| 84 | CDKN2D | 19210 | 18544 | -7.775 | 0.0039 | No |

