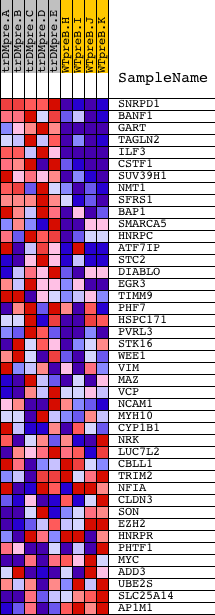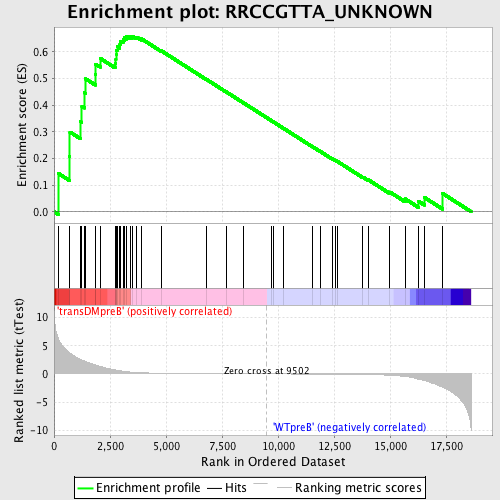
Profile of the Running ES Score & Positions of GeneSet Members on the Rank Ordered List
| Dataset | Set_04_transDMpreB_versus_WTpreB.phenotype_transDMpreB_versus_WTpreB.cls #transDMpreB_versus_WTpreB |
| Phenotype | phenotype_transDMpreB_versus_WTpreB.cls#transDMpreB_versus_WTpreB |
| Upregulated in class | transDMpreB |
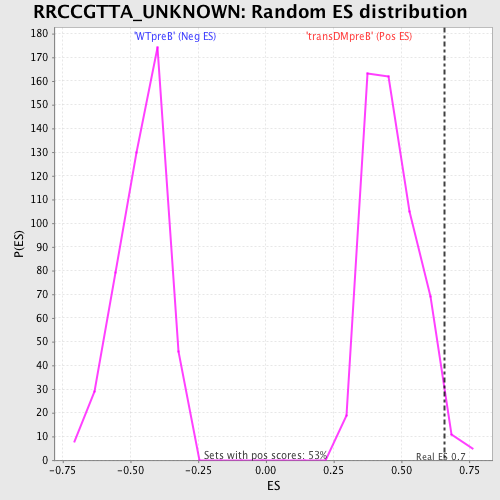
| GeneSet | RRCCGTTA_UNKNOWN |
| Enrichment Score (ES) | 0.6590136 |
| Normalized Enrichment Score (NES) | 1.4156239 |
| Nominal p-value | 0.026217228 |
| FDR q-value | 0.29611033 |
| FWER p-Value | 0.995 |
| PROBE | DESCRIPTION (from dataset) | GENE SYMBOL | GENE_TITLE | RANK IN GENE LIST | RANK METRIC SCORE | RUNNING ES | CORE ENRICHMENT | |
|---|---|---|---|---|---|---|---|---|
| 1 | SNRPD1 | 23622 | 192 | 6.236 | 0.1437 | Yes | ||
| 2 | BANF1 | 6216 10706 3760 | 692 | 3.726 | 0.2088 | Yes | ||
| 3 | GART | 22543 1754 | 706 | 3.684 | 0.2991 | Yes | ||
| 4 | TAGLN2 | 14043 | 1166 | 2.599 | 0.3386 | Yes | ||
| 5 | ILF3 | 3110 3030 9176 | 1240 | 2.476 | 0.3958 | Yes | ||
| 6 | CSTF1 | 12515 | 1365 | 2.310 | 0.4462 | Yes | ||
| 7 | SUV39H1 | 24194 | 1410 | 2.217 | 0.4986 | Yes | ||
| 8 | NMT1 | 20638 | 1843 | 1.605 | 0.5150 | Yes | ||
| 9 | SFRS1 | 8492 | 1857 | 1.596 | 0.5537 | Yes | ||
| 10 | BAP1 | 22057 | 2060 | 1.322 | 0.5755 | Yes | ||
| 11 | SMARCA5 | 8215 | 2725 | 0.723 | 0.5576 | Yes | ||
| 12 | HNRPC | 9102 4859 | 2758 | 0.698 | 0.5731 | Yes | ||
| 13 | ATF7IP | 12028 13038 | 2763 | 0.694 | 0.5900 | Yes | ||
| 14 | STC2 | 5526 | 2770 | 0.685 | 0.6066 | Yes | ||
| 15 | DIABLO | 16375 | 2815 | 0.649 | 0.6203 | Yes | ||
| 16 | EGR3 | 4656 | 2936 | 0.562 | 0.6277 | Yes | ||
| 17 | TIMM9 | 19686 | 2960 | 0.553 | 0.6401 | Yes | ||
| 18 | PHF7 | 21890 | 3080 | 0.474 | 0.6454 | Yes | ||
| 19 | HSPC171 | 18494 | 3140 | 0.442 | 0.6531 | Yes | ||
| 20 | PVRL3 | 1674 22579 1675 | 3239 | 0.393 | 0.6576 | Yes | ||
| 21 | STK16 | 14216 | 3414 | 0.326 | 0.6562 | Yes | ||
| 22 | WEE1 | 18127 | 3500 | 0.297 | 0.6590 | Yes | ||
| 23 | VIM | 80 | 3689 | 0.250 | 0.6551 | No | ||
| 24 | MAZ | 1327 17623 | 3902 | 0.209 | 0.6488 | No | ||
| 25 | VCP | 11254 | 4780 | 0.110 | 0.6043 | No | ||
| 26 | NCAM1 | 5149 | 6809 | 0.038 | 0.4961 | No | ||
| 27 | MYH10 | 8077 | 7677 | 0.024 | 0.4500 | No | ||
| 28 | CYP1B1 | 4581 | 8474 | 0.013 | 0.4075 | No | ||
| 29 | NRK | 6559 | 9714 | -0.003 | 0.3408 | No | ||
| 30 | LUC7L2 | 5313 5312 | 9796 | -0.004 | 0.3366 | No | ||
| 31 | CBLL1 | 4188 | 10257 | -0.010 | 0.3121 | No | ||
| 32 | TRIM2 | 13485 8157 | 11528 | -0.028 | 0.2444 | No | ||
| 33 | NFIA | 16172 5170 | 11870 | -0.034 | 0.2268 | No | ||
| 34 | CLDN3 | 16680 | 12423 | -0.046 | 0.1982 | No | ||
| 35 | SON | 5473 1657 1684 | 12559 | -0.049 | 0.1922 | No | ||
| 36 | EZH2 | 1092 17163 | 12641 | -0.051 | 0.1891 | No | ||
| 37 | HNRPR | 13196 7909 2500 | 13785 | -0.096 | 0.1299 | No | ||
| 38 | PHTF1 | 15469 | 14024 | -0.113 | 0.1199 | No | ||
| 39 | MYC | 22465 9435 | 14983 | -0.233 | 0.0741 | No | ||
| 40 | ADD3 | 23812 3694 | 15672 | -0.451 | 0.0482 | No | ||
| 41 | UBE2S | 17979 | 16264 | -0.933 | 0.0394 | No | ||
| 42 | SLC25A14 | 24344 | 16533 | -1.153 | 0.0534 | No | ||
| 43 | AP1M1 | 18571 | 17344 | -2.375 | 0.0685 | No |