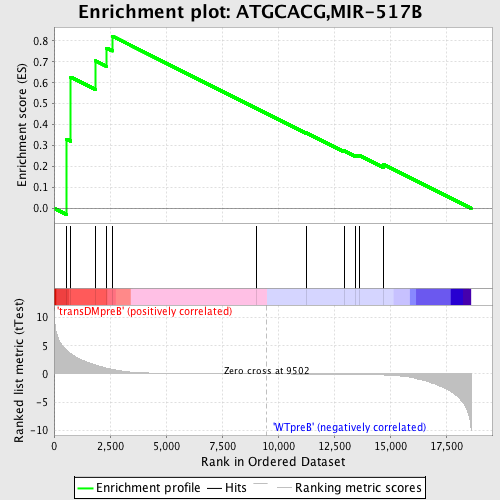
Profile of the Running ES Score & Positions of GeneSet Members on the Rank Ordered List
| Dataset | Set_04_transDMpreB_versus_WTpreB.phenotype_transDMpreB_versus_WTpreB.cls #transDMpreB_versus_WTpreB |
| Phenotype | phenotype_transDMpreB_versus_WTpreB.cls#transDMpreB_versus_WTpreB |
| Upregulated in class | transDMpreB |
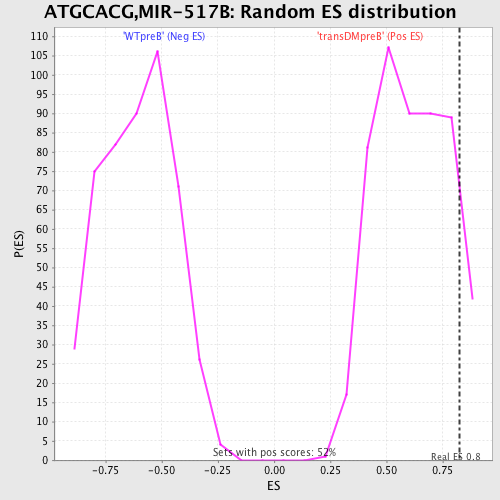
| GeneSet | ATGCACG,MIR-517B |
| Enrichment Score (ES) | 0.8231815 |
| Normalized Enrichment Score (NES) | 1.3395458 |
| Nominal p-value | 0.10444874 |
| FDR q-value | 0.24011248 |
| FWER p-Value | 1.0 |
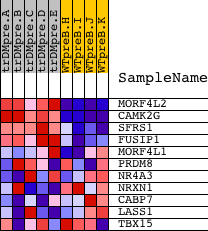
| PROBE | DESCRIPTION (from dataset) | GENE SYMBOL | GENE_TITLE | RANK IN GENE LIST | RANK METRIC SCORE | RUNNING ES | CORE ENRICHMENT | |
|---|---|---|---|---|---|---|---|---|
| 1 | MORF4L2 | 12118 | 551 | 4.203 | 0.3309 | Yes | ||
| 2 | CAMK2G | 21905 | 744 | 3.579 | 0.6276 | Yes | ||
| 3 | SFRS1 | 8492 | 1857 | 1.596 | 0.7047 | Yes | ||
| 4 | FUSIP1 | 4715 16036 | 2330 | 1.013 | 0.7662 | Yes | ||
| 5 | MORF4L1 | 5723 | 2596 | 0.830 | 0.8232 | Yes | ||
| 6 | PRDM8 | 8084 | 9045 | 0.006 | 0.4771 | No | ||
| 7 | NR4A3 | 9473 16212 5183 | 11250 | -0.023 | 0.3607 | No | ||
| 8 | NRXN1 | 1581 1575 22875 | 12942 | -0.059 | 0.2749 | No | ||
| 9 | CABP7 | 20542 | 13449 | -0.078 | 0.2543 | No | ||
| 10 | LASS1 | 3911 13566 | 13619 | -0.087 | 0.2527 | No | ||
| 11 | TBX15 | 5632 10040 | 14703 | -0.184 | 0.2103 | No |