Profile of the Running ES Score & Positions of GeneSet Members on the Rank Ordered List
| Dataset | Set_04_transDMpreB_versus_WTpreB.phenotype_transDMpreB_versus_WTpreB.cls #transDMpreB_versus_WTpreB |
| Phenotype | phenotype_transDMpreB_versus_WTpreB.cls#transDMpreB_versus_WTpreB |
| Upregulated in class | transDMpreB |
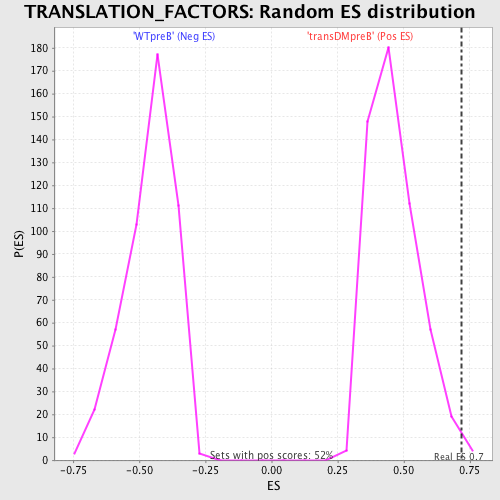
| GeneSet | TRANSLATION_FACTORS |
| Enrichment Score (ES) | 0.7189509 |
| Normalized Enrichment Score (NES) | 1.5551288 |
| Nominal p-value | 0.007633588 |
| FDR q-value | 0.08851889 |
| FWER p-Value | 0.701 |
| PROBE | DESCRIPTION (from dataset) | GENE SYMBOL | GENE_TITLE | RANK IN GENE LIST | RANK METRIC SCORE | RUNNING ES | CORE ENRICHMENT | |
|---|---|---|---|---|---|---|---|---|
| 1 | EIF4A1 | 8889 23719 | 38 | 8.864 | 0.0923 | Yes | ||
| 2 | EIF2B3 | 16118 | 87 | 7.555 | 0.1701 | Yes | ||
| 3 | EIF5A | 11345 20379 6590 | 125 | 6.952 | 0.2420 | Yes | ||
| 4 | EIF4G1 | 22818 | 222 | 5.960 | 0.3003 | Yes | ||
| 5 | EIF3S2 | 15744 2342 2478 | 291 | 5.509 | 0.3552 | Yes | ||
| 6 | ETF1 | 23467 | 301 | 5.421 | 0.4124 | Yes | ||
| 7 | EIF2AK2 | 22892 | 427 | 4.773 | 0.4564 | Yes | ||
| 8 | EEF1G | 12480 | 440 | 4.711 | 0.5059 | Yes | ||
| 9 | EIF2B1 | 16368 3458 | 513 | 4.387 | 0.5487 | Yes | ||
| 10 | EEF1B2 | 4131 12063 | 558 | 4.180 | 0.5908 | Yes | ||
| 11 | EIF2B5 | 1719 22822 | 812 | 3.400 | 0.6134 | Yes | ||
| 12 | EIF3S8 | 7099 12100 | 891 | 3.179 | 0.6430 | Yes | ||
| 13 | EIF3S7 | 22226 | 1118 | 2.690 | 0.6594 | Yes | ||
| 14 | EIF2B4 | 16574 | 1390 | 2.251 | 0.6688 | Yes | ||
| 15 | SLC35A4 | 12588 | 1488 | 2.071 | 0.6856 | Yes | ||
| 16 | EIF3S9 | 16643 3528 | 1782 | 1.662 | 0.6875 | Yes | ||
| 17 | EIF5 | 5736 | 1830 | 1.622 | 0.7022 | Yes | ||
| 18 | ITGB4BP | 9191 | 2024 | 1.371 | 0.7064 | Yes | ||
| 19 | EIF3S6 | 4924 | 2222 | 1.132 | 0.7079 | Yes | ||
| 20 | EIF3S10 | 4659 8887 | 2341 | 1.005 | 0.7122 | Yes | ||
| 21 | EIF4G3 | 10517 | 2409 | 0.972 | 0.7190 | Yes | ||
| 22 | EEF2 | 8881 4654 8882 | 2955 | 0.555 | 0.6955 | No | ||
| 23 | PAIP1 | 21556 | 4149 | 0.171 | 0.6331 | No | ||
| 24 | EIF2S1 | 4658 | 4310 | 0.151 | 0.6261 | No | ||
| 25 | EIF3S1 | 905 8114 | 4709 | 0.115 | 0.6059 | No | ||
| 26 | EIF1AY | 2643 24219 | 4879 | 0.104 | 0.5979 | No | ||
| 27 | EEF1A2 | 8880 14309 | 6081 | 0.054 | 0.5338 | No | ||
| 28 | PABPC1 | 5219 9522 9523 23572 | 7921 | 0.021 | 0.4350 | No | ||
| 29 | GSPT2 | 4806 | 10387 | -0.012 | 0.3024 | No | ||
| 30 | EIF4E | 15403 1827 8890 | 11391 | -0.025 | 0.2487 | No | ||
| 31 | EEF2K | 18101 | 12799 | -0.055 | 0.1735 | No | ||
| 32 | EIF5B | 10391 5963 | 13511 | -0.081 | 0.1361 | No | ||
| 33 | EIF2B2 | 21204 | 14972 | -0.230 | 0.0600 | No | ||
| 34 | EIF2S2 | 7406 14383 | 15832 | -0.534 | 0.0194 | No | ||
| 35 | EIF3S5 | 18131 | 16007 | -0.668 | 0.0171 | No | ||
| 36 | EIF3S3 | 12652 | 16092 | -0.736 | 0.0205 | No | ||
| 37 | EIF4EBP1 | 8891 4661 | 16113 | -0.761 | 0.0275 | No | ||
| 38 | EIF2AK1 | 4869 | 16144 | -0.803 | 0.0344 | No | ||
| 39 | EIF4A2 | 4660 1679 1645 | 16353 | -1.000 | 0.0338 | No | ||
| 40 | EIF3S4 | 6588 11988 | 16890 | -1.650 | 0.0225 | No | ||
| 41 | EIF4EBP2 | 4662 | 16905 | -1.677 | 0.0396 | No | ||
| 42 | EEF1D | 12393 2309 | 17259 | -2.231 | 0.0444 | No | ||
| 43 | EIF2AK3 | 17421 | 17530 | -2.693 | 0.0585 | No |