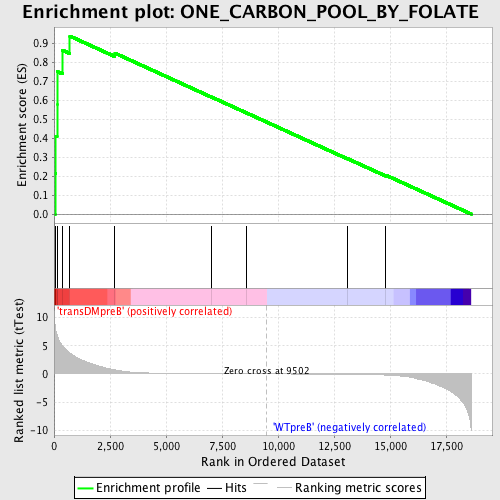
Profile of the Running ES Score & Positions of GeneSet Members on the Rank Ordered List
| Dataset | Set_04_transDMpreB_versus_WTpreB.phenotype_transDMpreB_versus_WTpreB.cls #transDMpreB_versus_WTpreB |
| Phenotype | phenotype_transDMpreB_versus_WTpreB.cls#transDMpreB_versus_WTpreB |
| Upregulated in class | transDMpreB |
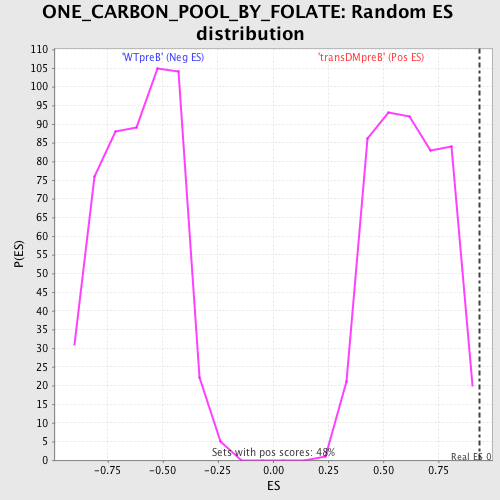
| GeneSet | ONE_CARBON_POOL_BY_FOLATE |
| Enrichment Score (ES) | 0.93630844 |
| Normalized Enrichment Score (NES) | 1.522139 |
| Nominal p-value | 0.0020833334 |
| FDR q-value | 0.13153584 |
| FWER p-Value | 0.88 |
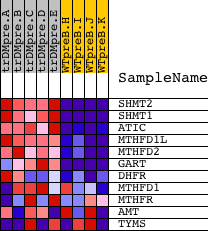
| PROBE | DESCRIPTION (from dataset) | GENE SYMBOL | GENE_TITLE | RANK IN GENE LIST | RANK METRIC SCORE | RUNNING ES | CORE ENRICHMENT | |
|---|---|---|---|---|---|---|---|---|
| 1 | SHMT2 | 3307 19601 | 42 | 8.654 | 0.2144 | Yes | ||
| 2 | SHMT1 | 5431 | 70 | 7.819 | 0.4087 | Yes | ||
| 3 | ATIC | 14231 3968 | 130 | 6.917 | 0.5787 | Yes | ||
| 4 | MTHFD1L | 11300 | 133 | 6.842 | 0.7499 | Yes | ||
| 5 | MTHFD2 | 17100 | 371 | 4.988 | 0.8620 | Yes | ||
| 6 | GART | 22543 1754 | 706 | 3.684 | 0.9363 | Yes | ||
| 7 | DHFR | 21590 | 2716 | 0.730 | 0.8466 | No | ||
| 8 | MTHFD1 | 2132 21238 | 7035 | 0.034 | 0.6154 | No | ||
| 9 | MTHFR | 5130 | 8585 | 0.012 | 0.5324 | No | ||
| 10 | AMT | 322 | 13104 | -0.065 | 0.2912 | No | ||
| 11 | TYMS | 5810 5809 3606 3598 | 14801 | -0.198 | 0.2050 | No |