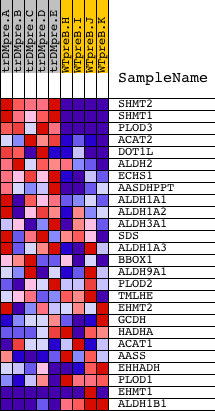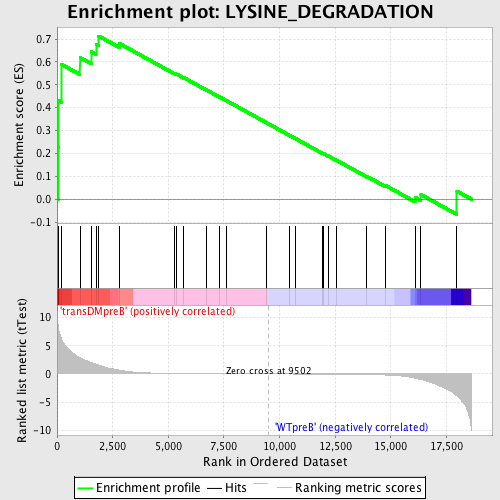
Profile of the Running ES Score & Positions of GeneSet Members on the Rank Ordered List
| Dataset | Set_04_transDMpreB_versus_WTpreB.phenotype_transDMpreB_versus_WTpreB.cls #transDMpreB_versus_WTpreB |
| Phenotype | phenotype_transDMpreB_versus_WTpreB.cls#transDMpreB_versus_WTpreB |
| Upregulated in class | transDMpreB |
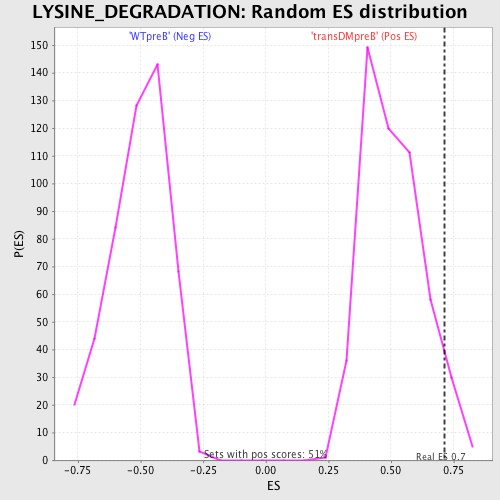
| GeneSet | LYSINE_DEGRADATION |
| Enrichment Score (ES) | 0.71319914 |
| Normalized Enrichment Score (NES) | 1.4066359 |
| Nominal p-value | 0.050980393 |
| FDR q-value | 0.43117058 |
| FWER p-Value | 1.0 |
| PROBE | DESCRIPTION (from dataset) | GENE SYMBOL | GENE_TITLE | RANK IN GENE LIST | RANK METRIC SCORE | RUNNING ES | CORE ENRICHMENT | |
|---|---|---|---|---|---|---|---|---|
| 1 | SHMT2 | 3307 19601 | 42 | 8.654 | 0.2259 | Yes | ||
| 2 | SHMT1 | 5431 | 70 | 7.819 | 0.4306 | Yes | ||
| 3 | PLOD3 | 16666 | 185 | 6.289 | 0.5903 | Yes | ||
| 4 | ACAT2 | 8484 1537 | 1028 | 2.833 | 0.6197 | Yes | ||
| 5 | DOT1L | 19937 | 1532 | 2.004 | 0.6455 | Yes | ||
| 6 | ALDH2 | 16384 | 1749 | 1.699 | 0.6787 | Yes | ||
| 7 | ECHS1 | 17573 | 1875 | 1.565 | 0.7132 | Yes | ||
| 8 | AASDHPPT | 7467 | 2794 | 0.664 | 0.6813 | No | ||
| 9 | ALDH1A1 | 8569 | 5274 | 0.082 | 0.5502 | No | ||
| 10 | ALDH1A2 | 19386 | 5364 | 0.078 | 0.5474 | No | ||
| 11 | ALDH3A1 | 20854 | 5700 | 0.064 | 0.5311 | No | ||
| 12 | SDS | 16722 3582 | 6715 | 0.040 | 0.4776 | No | ||
| 13 | ALDH1A3 | 17802 | 7276 | 0.030 | 0.4483 | No | ||
| 14 | BBOX1 | 5010 9290 | 7607 | 0.025 | 0.4312 | No | ||
| 15 | ALDH9A1 | 14064 | 9402 | 0.001 | 0.3347 | No | ||
| 16 | PLOD2 | 19352 | 10435 | -0.012 | 0.2795 | No | ||
| 17 | TMLHE | 5320 | 10704 | -0.016 | 0.2655 | No | ||
| 18 | EHMT2 | 23269 1563 | 11922 | -0.035 | 0.2010 | No | ||
| 19 | GCDH | 3913 18812 | 11969 | -0.035 | 0.1994 | No | ||
| 20 | HADHA | 16579 | 12181 | -0.040 | 0.1891 | No | ||
| 21 | ACAT1 | 19114 10019 | 12548 | -0.049 | 0.1707 | No | ||
| 22 | AASS | 17208 1126 1026 | 13925 | -0.107 | 0.0995 | No | ||
| 23 | EHHADH | 22635 | 14744 | -0.190 | 0.0605 | No | ||
| 24 | PLOD1 | 15679 | 16095 | -0.738 | 0.0074 | No | ||
| 25 | EHMT1 | 13401 14670 2756 8090 | 16354 | -1.000 | 0.0198 | No | ||
| 26 | ALDH1B1 | 16219 | 17971 | -3.860 | 0.0347 | No |