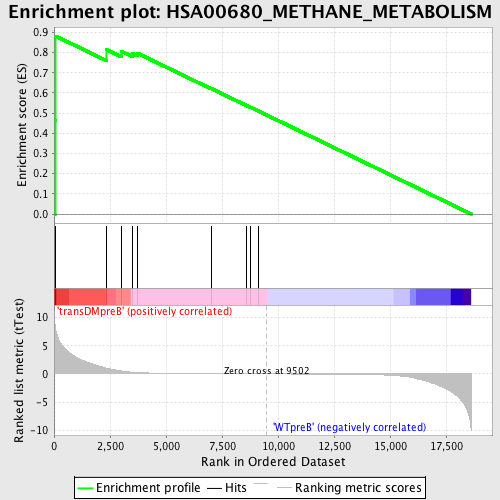
Profile of the Running ES Score & Positions of GeneSet Members on the Rank Ordered List
| Dataset | Set_04_transDMpreB_versus_WTpreB.phenotype_transDMpreB_versus_WTpreB.cls #transDMpreB_versus_WTpreB |
| Phenotype | phenotype_transDMpreB_versus_WTpreB.cls#transDMpreB_versus_WTpreB |
| Upregulated in class | transDMpreB |
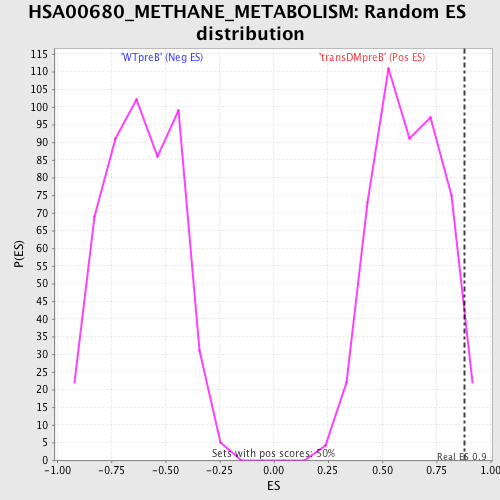
| GeneSet | HSA00680_METHANE_METABOLISM |
| Enrichment Score (ES) | 0.8816575 |
| Normalized Enrichment Score (NES) | 1.4219297 |
| Nominal p-value | 0.024242423 |
| FDR q-value | 0.38325548 |
| FWER p-Value | 1.0 |
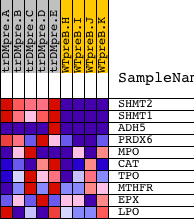
| PROBE | DESCRIPTION (from dataset) | GENE SYMBOL | GENE_TITLE | RANK IN GENE LIST | RANK METRIC SCORE | RUNNING ES | CORE ENRICHMENT | |
|---|---|---|---|---|---|---|---|---|
| 1 | SHMT2 | 3307 19601 | 42 | 8.654 | 0.4628 | Yes | ||
| 2 | SHMT1 | 5431 | 70 | 7.819 | 0.8817 | Yes | ||
| 3 | ADH5 | 8554 15404 | 2329 | 1.013 | 0.8147 | No | ||
| 4 | PRDX6 | 4389 8596 | 2999 | 0.523 | 0.8069 | No | ||
| 5 | MPO | 5116 20710 1324 | 3507 | 0.295 | 0.7955 | No | ||
| 6 | CAT | 14508 | 3732 | 0.242 | 0.7964 | No | ||
| 7 | TPO | 21092 | 7011 | 0.035 | 0.6221 | No | ||
| 8 | MTHFR | 5130 | 8585 | 0.012 | 0.5382 | No | ||
| 9 | EPX | 20302 | 8753 | 0.009 | 0.5297 | No | ||
| 10 | LPO | 20303 | 9125 | 0.005 | 0.5101 | No |