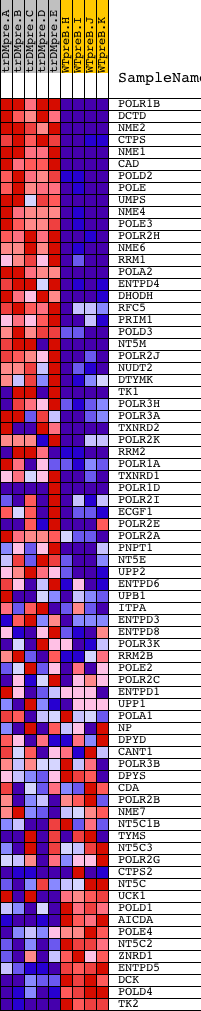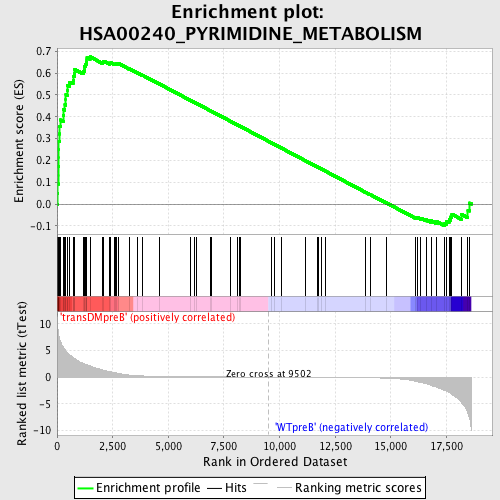
Profile of the Running ES Score & Positions of GeneSet Members on the Rank Ordered List
| Dataset | Set_04_transDMpreB_versus_WTpreB.phenotype_transDMpreB_versus_WTpreB.cls #transDMpreB_versus_WTpreB |
| Phenotype | phenotype_transDMpreB_versus_WTpreB.cls#transDMpreB_versus_WTpreB |
| Upregulated in class | transDMpreB |
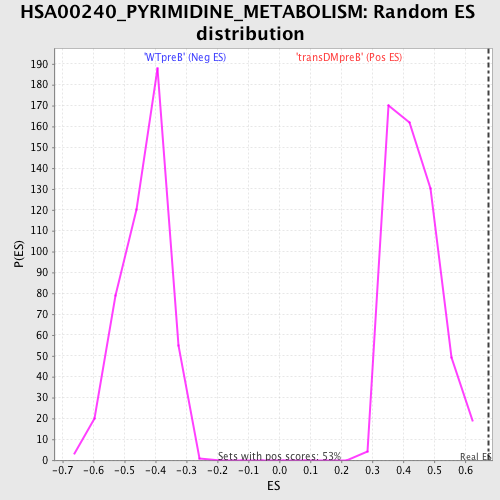
| GeneSet | HSA00240_PYRIMIDINE_METABOLISM |
| Enrichment Score (ES) | 0.67460155 |
| Normalized Enrichment Score (NES) | 1.5614544 |
| Nominal p-value | 0.0 |
| FDR q-value | 0.09985795 |
| FWER p-Value | 0.667 |
| PROBE | DESCRIPTION (from dataset) | GENE SYMBOL | GENE_TITLE | RANK IN GENE LIST | RANK METRIC SCORE | RUNNING ES | CORE ENRICHMENT | |
|---|---|---|---|---|---|---|---|---|
| 1 | POLR1B | 14857 | 9 | 10.065 | 0.0493 | Yes | ||
| 2 | DCTD | 18620 | 33 | 8.964 | 0.0924 | Yes | ||
| 3 | NME2 | 9468 | 49 | 8.321 | 0.1328 | Yes | ||
| 4 | CTPS | 2514 15772 | 50 | 8.280 | 0.1737 | Yes | ||
| 5 | NME1 | 9467 | 68 | 7.855 | 0.2117 | Yes | ||
| 6 | CAD | 16886 | 71 | 7.817 | 0.2502 | Yes | ||
| 7 | POLD2 | 20537 | 78 | 7.693 | 0.2879 | Yes | ||
| 8 | POLE | 16755 | 111 | 7.095 | 0.3213 | Yes | ||
| 9 | UMPS | 22606 1760 | 120 | 7.024 | 0.3556 | Yes | ||
| 10 | NME4 | 23065 1577 | 165 | 6.514 | 0.3855 | Yes | ||
| 11 | POLE3 | 7200 | 276 | 5.588 | 0.4072 | Yes | ||
| 12 | POLR2H | 10888 | 296 | 5.463 | 0.4332 | Yes | ||
| 13 | NME6 | 3139 19297 | 352 | 5.107 | 0.4555 | Yes | ||
| 14 | RRM1 | 18163 | 391 | 4.897 | 0.4777 | Yes | ||
| 15 | POLA2 | 23988 | 396 | 4.885 | 0.5016 | Yes | ||
| 16 | ENTPD4 | 7449 | 455 | 4.622 | 0.5213 | Yes | ||
| 17 | DHODH | 7152 | 466 | 4.573 | 0.5434 | Yes | ||
| 18 | RFC5 | 13005 7791 | 568 | 4.143 | 0.5585 | Yes | ||
| 19 | PRIM1 | 19847 | 719 | 3.648 | 0.5684 | Yes | ||
| 20 | POLD3 | 17742 | 746 | 3.578 | 0.5847 | Yes | ||
| 21 | NT5M | 8345 4175 | 778 | 3.508 | 0.6004 | Yes | ||
| 22 | POLR2J | 16672 | 793 | 3.452 | 0.6167 | Yes | ||
| 23 | NUDT2 | 16239 | 1174 | 2.584 | 0.6090 | Yes | ||
| 24 | DTYMK | 5776 | 1230 | 2.487 | 0.6183 | Yes | ||
| 25 | TK1 | 1457 10182 5762 | 1237 | 2.480 | 0.6303 | Yes | ||
| 26 | POLR3H | 13460 8135 | 1275 | 2.423 | 0.6403 | Yes | ||
| 27 | POLR3A | 21900 | 1307 | 2.378 | 0.6504 | Yes | ||
| 28 | TXNRD2 | 22829 1649 | 1339 | 2.342 | 0.6603 | Yes | ||
| 29 | POLR2K | 9413 | 1342 | 2.339 | 0.6717 | Yes | ||
| 30 | RRM2 | 5401 5400 | 1481 | 2.084 | 0.6746 | Yes | ||
| 31 | POLR1A | 9749 5393 | 2044 | 1.341 | 0.6509 | No | ||
| 32 | TXNRD1 | 19923 | 2092 | 1.289 | 0.6548 | No | ||
| 33 | POLR1D | 3593 3658 16623 | 2342 | 1.005 | 0.6463 | No | ||
| 34 | POLR2I | 12839 | 2417 | 0.967 | 0.6471 | No | ||
| 35 | ECGF1 | 22160 | 2592 | 0.833 | 0.6418 | No | ||
| 36 | POLR2E | 3325 19699 | 2644 | 0.791 | 0.6430 | No | ||
| 37 | POLR2A | 5394 | 2663 | 0.775 | 0.6459 | No | ||
| 38 | PNPT1 | 20936 | 2768 | 0.688 | 0.6437 | No | ||
| 39 | NT5E | 19360 18702 | 3241 | 0.392 | 0.6201 | No | ||
| 40 | UPP2 | 15009 13346 8032 | 3631 | 0.264 | 0.6005 | No | ||
| 41 | ENTPD6 | 4496 2678 | 3839 | 0.221 | 0.5904 | No | ||
| 42 | UPB1 | 19988 3389 | 4581 | 0.125 | 0.5510 | No | ||
| 43 | ITPA | 9193 | 5988 | 0.056 | 0.4755 | No | ||
| 44 | ENTPD3 | 19266 | 6163 | 0.052 | 0.4664 | No | ||
| 45 | ENTPD8 | 12996 | 6283 | 0.049 | 0.4602 | No | ||
| 46 | POLR3K | 12447 7372 | 6894 | 0.037 | 0.4275 | No | ||
| 47 | RRM2B | 6902 6903 11801 | 6928 | 0.036 | 0.4259 | No | ||
| 48 | POLE2 | 21053 | 7814 | 0.022 | 0.3782 | No | ||
| 49 | POLR2C | 9750 | 8109 | 0.018 | 0.3625 | No | ||
| 50 | ENTPD1 | 4495 | 8186 | 0.017 | 0.3585 | No | ||
| 51 | UPP1 | 20947 1385 | 8236 | 0.016 | 0.3559 | No | ||
| 52 | POLA1 | 24112 | 9653 | -0.002 | 0.2795 | No | ||
| 53 | NP | 22027 9597 5273 5274 | 9774 | -0.004 | 0.2731 | No | ||
| 54 | DPYD | 15437 | 10099 | -0.008 | 0.2556 | No | ||
| 55 | CANT1 | 13304 | 11171 | -0.022 | 0.1980 | No | ||
| 56 | POLR3B | 12875 | 11699 | -0.031 | 0.1697 | No | ||
| 57 | DPYS | 22305 | 11734 | -0.031 | 0.1680 | No | ||
| 58 | CDA | 15702 | 11871 | -0.034 | 0.1609 | No | ||
| 59 | POLR2B | 16817 | 12062 | -0.037 | 0.1508 | No | ||
| 60 | NME7 | 926 4101 14070 3986 3946 931 | 13867 | -0.102 | 0.0540 | No | ||
| 61 | NT5C1B | 21315 | 14066 | -0.116 | 0.0439 | No | ||
| 62 | TYMS | 5810 5809 3606 3598 | 14801 | -0.198 | 0.0053 | No | ||
| 63 | NT5C3 | 17136 | 16129 | -0.777 | -0.0624 | No | ||
| 64 | POLR2G | 23753 | 16179 | -0.839 | -0.0609 | No | ||
| 65 | CTPS2 | 12060 2571 | 16346 | -0.998 | -0.0649 | No | ||
| 66 | NT5C | 20151 | 16582 | -1.203 | -0.0717 | No | ||
| 67 | UCK1 | 10254 5831 10253 | 16812 | -1.526 | -0.0765 | No | ||
| 68 | POLD1 | 17847 | 17042 | -1.851 | -0.0797 | No | ||
| 69 | AICDA | 17295 1087 | 17427 | -2.522 | -0.0879 | No | ||
| 70 | POLE4 | 12441 | 17502 | -2.639 | -0.0788 | No | ||
| 71 | NT5C2 | 3768 8052 | 17618 | -2.872 | -0.0708 | No | ||
| 72 | ZNRD1 | 1491 22987 | 17682 | -3.030 | -0.0592 | No | ||
| 73 | ENTPD5 | 4497 | 17744 | -3.169 | -0.0468 | No | ||
| 74 | DCK | 16808 | 18181 | -4.761 | -0.0468 | No | ||
| 75 | POLD4 | 12822 | 18466 | -6.742 | -0.0288 | No | ||
| 76 | TK2 | 18779 | 18525 | -7.441 | 0.0049 | No |