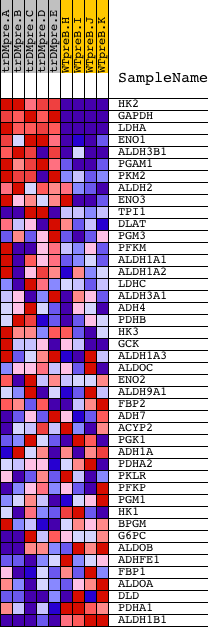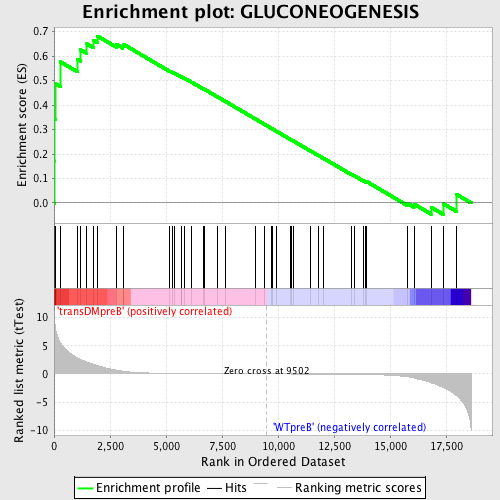
Profile of the Running ES Score & Positions of GeneSet Members on the Rank Ordered List
| Dataset | Set_04_transDMpreB_versus_WTpreB.phenotype_transDMpreB_versus_WTpreB.cls #transDMpreB_versus_WTpreB |
| Phenotype | phenotype_transDMpreB_versus_WTpreB.cls#transDMpreB_versus_WTpreB |
| Upregulated in class | transDMpreB |
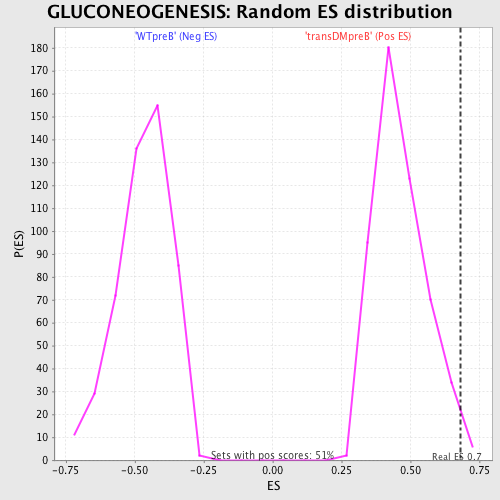
| GeneSet | GLUCONEOGENESIS |
| Enrichment Score (ES) | 0.6814271 |
| Normalized Enrichment Score (NES) | 1.4675609 |
| Nominal p-value | 0.01764706 |
| FDR q-value | 0.22779101 |
| FWER p-Value | 0.993 |
| PROBE | DESCRIPTION (from dataset) | GENE SYMBOL | GENE_TITLE | RANK IN GENE LIST | RANK METRIC SCORE | RUNNING ES | CORE ENRICHMENT | |
|---|---|---|---|---|---|---|---|---|
| 1 | HK2 | 17106 | 20 | 9.552 | 0.1715 | Yes | ||
| 2 | GAPDH | 348 348 9002 | 23 | 9.387 | 0.3409 | Yes | ||
| 3 | LDHA | 9269 | 53 | 8.202 | 0.4875 | Yes | ||
| 4 | ENO1 | 8903 | 272 | 5.604 | 0.5770 | Yes | ||
| 5 | ALDH3B1 | 12569 23949 | 1035 | 2.823 | 0.5869 | Yes | ||
| 6 | PGAM1 | 9556 | 1181 | 2.567 | 0.6255 | Yes | ||
| 7 | PKM2 | 3642 9573 | 1435 | 2.171 | 0.6510 | Yes | ||
| 8 | ALDH2 | 16384 | 1749 | 1.699 | 0.6649 | Yes | ||
| 9 | ENO3 | 8905 | 1939 | 1.479 | 0.6814 | Yes | ||
| 10 | TPI1 | 5795 10212 | 2792 | 0.665 | 0.6476 | No | ||
| 11 | DLAT | 19123 | 3075 | 0.475 | 0.6410 | No | ||
| 12 | PGM3 | 19045 | 3114 | 0.454 | 0.6471 | No | ||
| 13 | PFKM | 5243 9554 | 5156 | 0.088 | 0.5388 | No | ||
| 14 | ALDH1A1 | 8569 | 5274 | 0.082 | 0.5340 | No | ||
| 15 | ALDH1A2 | 19386 | 5364 | 0.078 | 0.5306 | No | ||
| 16 | LDHC | 18235 2235 | 5678 | 0.065 | 0.5149 | No | ||
| 17 | ALDH3A1 | 20854 | 5700 | 0.064 | 0.5150 | No | ||
| 18 | ADH4 | 15405 | 5834 | 0.060 | 0.5089 | No | ||
| 19 | PDHB | 12670 7548 | 6153 | 0.052 | 0.4927 | No | ||
| 20 | HK3 | 3224 477 | 6646 | 0.041 | 0.4670 | No | ||
| 21 | GCK | 20535 | 6730 | 0.040 | 0.4632 | No | ||
| 22 | ALDH1A3 | 17802 | 7276 | 0.030 | 0.4344 | No | ||
| 23 | ALDOC | 20759 311 | 7658 | 0.024 | 0.4143 | No | ||
| 24 | ENO2 | 8904 | 8991 | 0.007 | 0.3427 | No | ||
| 25 | ALDH9A1 | 14064 | 9402 | 0.001 | 0.3207 | No | ||
| 26 | FBP2 | 21422 | 9717 | -0.003 | 0.3038 | No | ||
| 27 | ADH7 | 15408 | 9732 | -0.003 | 0.3031 | No | ||
| 28 | ACYP2 | 20508 | 9921 | -0.006 | 0.2931 | No | ||
| 29 | PGK1 | 9557 5244 | 10544 | -0.014 | 0.2599 | No | ||
| 30 | ADH1A | 15406 | 10601 | -0.014 | 0.2571 | No | ||
| 31 | PDHA2 | 15153 | 10692 | -0.015 | 0.2526 | No | ||
| 32 | PKLR | 1850 15545 | 11428 | -0.026 | 0.2134 | No | ||
| 33 | PFKP | 3267 3168 7118 | 11800 | -0.032 | 0.1941 | No | ||
| 34 | PGM1 | 16841 | 12024 | -0.036 | 0.1827 | No | ||
| 35 | HK1 | 4854 | 13257 | -0.070 | 0.1176 | No | ||
| 36 | BPGM | 17489 | 13395 | -0.076 | 0.1116 | No | ||
| 37 | G6PC | 20656 | 13820 | -0.099 | 0.0906 | No | ||
| 38 | ALDOB | 10494 | 13921 | -0.106 | 0.0871 | No | ||
| 39 | ADHFE1 | 4049 8008 | 13938 | -0.108 | 0.0882 | No | ||
| 40 | FBP1 | 21423 | 15774 | -0.498 | -0.0016 | No | ||
| 41 | ALDOA | 8572 | 16067 | -0.712 | -0.0045 | No | ||
| 42 | DLD | 2097 21090 | 16828 | -1.548 | -0.0174 | No | ||
| 43 | PDHA1 | 24020 | 17378 | -2.429 | -0.0031 | No | ||
| 44 | ALDH1B1 | 16219 | 17971 | -3.860 | 0.0347 | No |