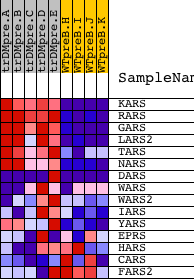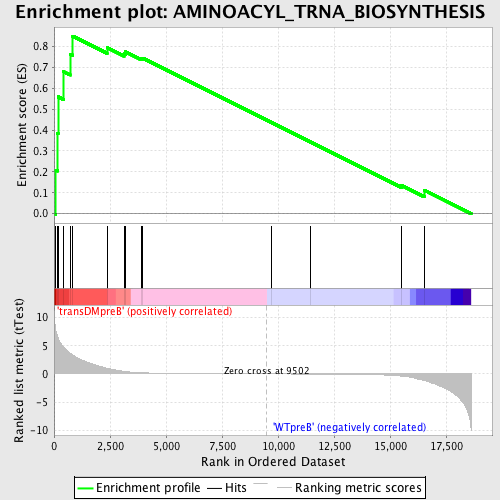
Profile of the Running ES Score & Positions of GeneSet Members on the Rank Ordered List
| Dataset | Set_04_transDMpreB_versus_WTpreB.phenotype_transDMpreB_versus_WTpreB.cls #transDMpreB_versus_WTpreB |
| Phenotype | phenotype_transDMpreB_versus_WTpreB.cls#transDMpreB_versus_WTpreB |
| Upregulated in class | transDMpreB |
| GeneSet | AMINOACYL_TRNA_BIOSYNTHESIS |
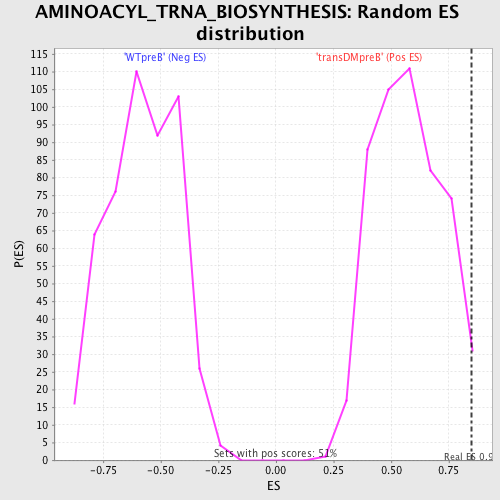
| Enrichment Score (ES) | 0.85016906 |
| Normalized Enrichment Score (NES) | 1.474266 |
| Nominal p-value | 0.017681729 |
| FDR q-value | 0.22147408 |
| FWER p-Value | 0.988 |
| PROBE | DESCRIPTION (from dataset) | GENE SYMBOL | GENE_TITLE | RANK IN GENE LIST | RANK METRIC SCORE | RUNNING ES | CORE ENRICHMENT | |
|---|---|---|---|---|---|---|---|---|
| 1 | KARS | 18738 | 77 | 7.720 | 0.2083 | Yes | ||
| 2 | RARS | 20496 | 157 | 6.592 | 0.3854 | Yes | ||
| 3 | GARS | 17438 | 180 | 6.371 | 0.5595 | Yes | ||
| 4 | LARS2 | 19255 | 413 | 4.828 | 0.6799 | Yes | ||
| 5 | TARS | 22325 8502 | 713 | 3.656 | 0.7644 | Yes | ||
| 6 | NARS | 23418 | 832 | 3.347 | 0.8502 | Yes | ||
| 7 | DARS | 10375 13846 | 2364 | 0.998 | 0.7953 | No | ||
| 8 | WARS | 2085 20984 | 3121 | 0.450 | 0.7671 | No | ||
| 9 | WARS2 | 12884 7688 | 3184 | 0.418 | 0.7753 | No | ||
| 10 | IARS | 4190 8361 8362 | 3903 | 0.209 | 0.7424 | No | ||
| 11 | YARS | 16071 | 3967 | 0.199 | 0.7445 | No | ||
| 12 | EPRS | 14014 | 9703 | -0.003 | 0.4363 | No | ||
| 13 | HARS | 23451 | 11462 | -0.027 | 0.3425 | No | ||
| 14 | CARS | 1683 17544 | 15507 | -0.382 | 0.1356 | No | ||
| 15 | FARS2 | 21666 | 16524 | -1.143 | 0.1125 | No |