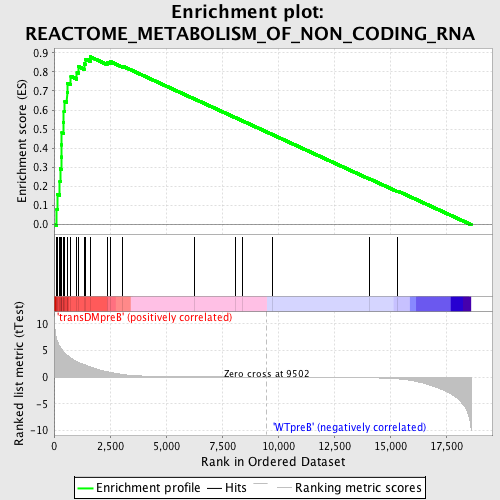
Profile of the Running ES Score & Positions of GeneSet Members on the Rank Ordered List
| Dataset | Set_04_transDMpreB_versus_WTpreB.phenotype_transDMpreB_versus_WTpreB.cls #transDMpreB_versus_WTpreB |
| Phenotype | phenotype_transDMpreB_versus_WTpreB.cls#transDMpreB_versus_WTpreB |
| Upregulated in class | transDMpreB |
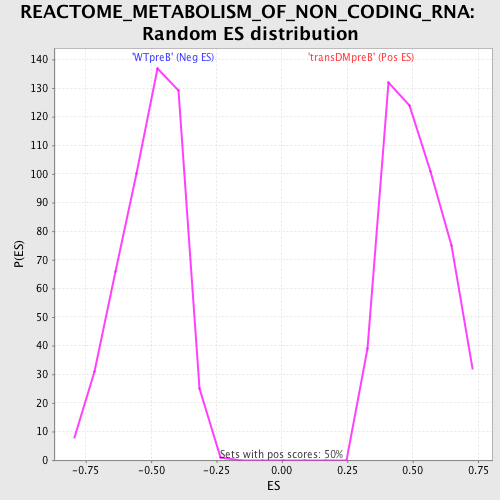
| GeneSet | REACTOME_METABOLISM_OF_NON_CODING_RNA |
| Enrichment Score (ES) | 0.87864697 |
| Normalized Enrichment Score (NES) | 1.7298558 |
| Nominal p-value | 0.0 |
| FDR q-value | 0.0020776277 |
| FWER p-Value | 0.021 |
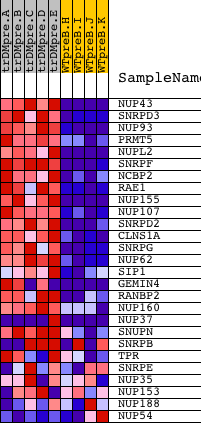
| PROBE | DESCRIPTION (from dataset) | GENE SYMBOL | GENE_TITLE | RANK IN GENE LIST | RANK METRIC SCORE | RUNNING ES | CORE ENRICHMENT | |
|---|---|---|---|---|---|---|---|---|
| 1 | NUP43 | 20094 | 123 | 6.959 | 0.0791 | Yes | ||
| 2 | SNRPD3 | 12514 | 144 | 6.702 | 0.1606 | Yes | ||
| 3 | NUP93 | 7762 | 258 | 5.682 | 0.2245 | Yes | ||
| 4 | PRMT5 | 6571 2817 | 274 | 5.593 | 0.2926 | Yes | ||
| 5 | NUPL2 | 6072 | 325 | 5.245 | 0.3545 | Yes | ||
| 6 | SNRPF | 7645 | 340 | 5.175 | 0.4175 | Yes | ||
| 7 | NCBP2 | 12643 | 349 | 5.124 | 0.4802 | Yes | ||
| 8 | RAE1 | 12395 | 415 | 4.823 | 0.5362 | Yes | ||
| 9 | NUP155 | 2298 5027 | 439 | 4.717 | 0.5930 | Yes | ||
| 10 | NUP107 | 8337 | 481 | 4.522 | 0.6465 | Yes | ||
| 11 | SNRPD2 | 8412 | 575 | 4.118 | 0.6923 | Yes | ||
| 12 | CLNS1A | 4526 4525 | 606 | 4.015 | 0.7401 | Yes | ||
| 13 | SNRPG | 12622 | 750 | 3.566 | 0.7763 | Yes | ||
| 14 | NUP62 | 9497 | 1020 | 2.854 | 0.7970 | Yes | ||
| 15 | SIP1 | 21263 | 1083 | 2.751 | 0.8276 | Yes | ||
| 16 | GEMIN4 | 6592 6591 | 1345 | 2.333 | 0.8423 | Yes | ||
| 17 | RANBP2 | 20019 | 1406 | 2.225 | 0.8665 | Yes | ||
| 18 | NUP160 | 14957 | 1613 | 1.888 | 0.8786 | Yes | ||
| 19 | NUP37 | 3294 3326 19909 | 2367 | 0.998 | 0.8504 | No | ||
| 20 | SNUPN | 12282 | 2523 | 0.885 | 0.8530 | No | ||
| 21 | SNRPB | 9842 5469 2736 | 3074 | 0.477 | 0.8293 | No | ||
| 22 | TPR | 927 4255 | 6244 | 0.050 | 0.6594 | No | ||
| 23 | SNRPE | 9843 | 8093 | 0.018 | 0.5602 | No | ||
| 24 | NUP35 | 12803 | 8427 | 0.014 | 0.5425 | No | ||
| 25 | NUP153 | 21474 | 9748 | -0.003 | 0.4715 | No | ||
| 26 | NUP188 | 15053 | 14093 | -0.118 | 0.2393 | No | ||
| 27 | NUP54 | 11231 11232 6516 | 15341 | -0.320 | 0.1762 | No |