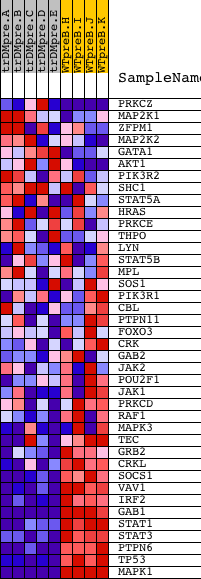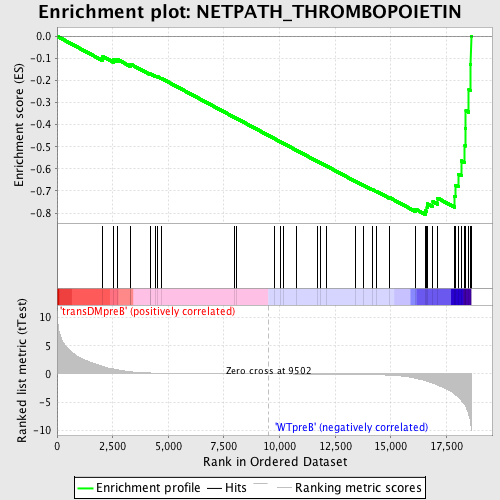
Profile of the Running ES Score & Positions of GeneSet Members on the Rank Ordered List
| Dataset | Set_04_transDMpreB_versus_WTpreB.phenotype_transDMpreB_versus_WTpreB.cls #transDMpreB_versus_WTpreB |
| Phenotype | phenotype_transDMpreB_versus_WTpreB.cls#transDMpreB_versus_WTpreB |
| Upregulated in class | WTpreB |
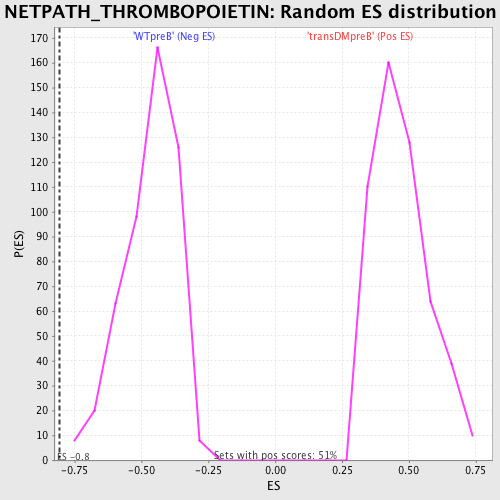
| GeneSet | NETPATH_THROMBOPOIETIN |
| Enrichment Score (ES) | -0.806375 |
| Normalized Enrichment Score (NES) | -1.7305489 |
| Nominal p-value | 0.0 |
| FDR q-value | 0.024017552 |
| FWER p-Value | 0.042 |
| PROBE | DESCRIPTION (from dataset) | GENE SYMBOL | GENE_TITLE | RANK IN GENE LIST | RANK METRIC SCORE | RUNNING ES | CORE ENRICHMENT | |
|---|---|---|---|---|---|---|---|---|
| 1 | PRKCZ | 5260 | 2053 | 1.330 | -0.0919 | No | ||
| 2 | MAP2K1 | 19082 | 2547 | 0.862 | -0.1063 | No | ||
| 3 | ZFPM1 | 18439 | 2724 | 0.723 | -0.1056 | No | ||
| 4 | MAP2K2 | 19933 | 3294 | 0.375 | -0.1310 | No | ||
| 5 | GATA1 | 24196 | 3313 | 0.366 | -0.1269 | No | ||
| 6 | AKT1 | 8568 | 4184 | 0.164 | -0.1714 | No | ||
| 7 | PIK3R2 | 18850 | 4208 | 0.163 | -0.1703 | No | ||
| 8 | SHC1 | 9813 9812 5430 | 4421 | 0.139 | -0.1798 | No | ||
| 9 | STAT5A | 20664 | 4510 | 0.131 | -0.1827 | No | ||
| 10 | HRAS | 4868 | 4707 | 0.115 | -0.1916 | No | ||
| 11 | PRKCE | 9575 | 7969 | 0.020 | -0.3669 | No | ||
| 12 | THPO | 22636 | 8051 | 0.019 | -0.3710 | No | ||
| 13 | LYN | 16281 | 9750 | -0.003 | -0.4623 | No | ||
| 14 | STAT5B | 20222 | 10037 | -0.007 | -0.4776 | No | ||
| 15 | MPL | 15780 | 10175 | -0.009 | -0.4849 | No | ||
| 16 | SOS1 | 5476 | 10751 | -0.016 | -0.5156 | No | ||
| 17 | PIK3R1 | 3170 | 11694 | -0.031 | -0.5659 | No | ||
| 18 | CBL | 19154 | 11843 | -0.033 | -0.5734 | No | ||
| 19 | PTPN11 | 5326 16391 9660 | 12087 | -0.038 | -0.5860 | No | ||
| 20 | FOXO3 | 19782 3402 | 13431 | -0.077 | -0.6572 | No | ||
| 21 | CRK | 4559 1249 | 13780 | -0.096 | -0.6745 | No | ||
| 22 | GAB2 | 1821 18184 2025 | 14159 | -0.123 | -0.6932 | No | ||
| 23 | JAK2 | 23893 9197 3706 | 14343 | -0.140 | -0.7011 | No | ||
| 24 | POU2F1 | 5275 3989 4065 4010 | 14949 | -0.225 | -0.7305 | No | ||
| 25 | JAK1 | 15827 | 16111 | -0.760 | -0.7823 | No | ||
| 26 | PRKCD | 21897 | 16559 | -1.188 | -0.7897 | Yes | ||
| 27 | RAF1 | 17035 | 16625 | -1.259 | -0.7756 | Yes | ||
| 28 | MAPK3 | 6458 11170 | 16645 | -1.295 | -0.7584 | Yes | ||
| 29 | TEC | 16514 | 16891 | -1.651 | -0.7485 | Yes | ||
| 30 | GRB2 | 20149 | 17099 | -1.953 | -0.7322 | Yes | ||
| 31 | CRKL | 4560 | 17866 | -3.568 | -0.7234 | Yes | ||
| 32 | SOCS1 | 4522 | 17909 | -3.698 | -0.6738 | Yes | ||
| 33 | VAV1 | 23173 | 18053 | -4.129 | -0.6236 | Yes | ||
| 34 | IRF2 | 18621 | 18175 | -4.721 | -0.5640 | Yes | ||
| 35 | GAB1 | 18828 | 18330 | -5.503 | -0.4951 | Yes | ||
| 36 | STAT1 | 3936 5524 | 18359 | -5.675 | -0.4170 | Yes | ||
| 37 | STAT3 | 5525 9906 | 18377 | -5.818 | -0.3364 | Yes | ||
| 38 | PTPN6 | 17002 | 18509 | -7.257 | -0.2417 | Yes | ||
| 39 | TP53 | 20822 | 18572 | -8.381 | -0.1275 | Yes | ||
| 40 | MAPK1 | 1642 11167 | 18603 | -9.259 | 0.0007 | Yes |