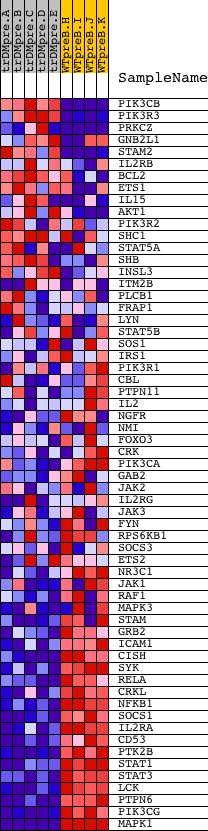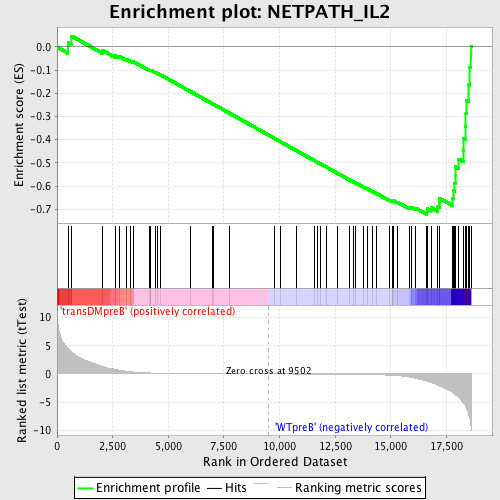
Profile of the Running ES Score & Positions of GeneSet Members on the Rank Ordered List
| Dataset | Set_04_transDMpreB_versus_WTpreB.phenotype_transDMpreB_versus_WTpreB.cls #transDMpreB_versus_WTpreB |
| Phenotype | phenotype_transDMpreB_versus_WTpreB.cls#transDMpreB_versus_WTpreB |
| Upregulated in class | WTpreB |
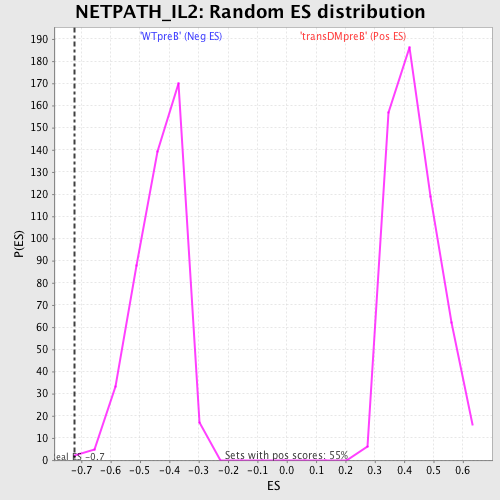
| GeneSet | NETPATH_IL2 |
| Enrichment Score (ES) | -0.72269946 |
| Normalized Enrichment Score (NES) | -1.6590395 |
| Nominal p-value | 0.002202643 |
| FDR q-value | 0.030762736 |
| FWER p-Value | 0.244 |
| PROBE | DESCRIPTION (from dataset) | GENE SYMBOL | GENE_TITLE | RANK IN GENE LIST | RANK METRIC SCORE | RUNNING ES | CORE ENRICHMENT | |
|---|---|---|---|---|---|---|---|---|
| 1 | PIK3CB | 19030 | 489 | 4.489 | 0.0177 | No | ||
| 2 | PIK3R3 | 5248 | 656 | 3.876 | 0.0468 | No | ||
| 3 | PRKCZ | 5260 | 2053 | 1.330 | -0.0154 | No | ||
| 4 | GNB2L1 | 20911 | 2614 | 0.815 | -0.0375 | No | ||
| 5 | STAM2 | 7095 2845 | 2793 | 0.665 | -0.0406 | No | ||
| 6 | IL2RB | 22219 | 3098 | 0.465 | -0.0524 | No | ||
| 7 | BCL2 | 8651 3928 13864 4435 981 4062 13863 4027 | 3317 | 0.365 | -0.0606 | No | ||
| 8 | ETS1 | 10715 6230 3135 | 3419 | 0.324 | -0.0628 | No | ||
| 9 | IL15 | 18826 3801 | 4142 | 0.172 | -0.1001 | No | ||
| 10 | AKT1 | 8568 | 4184 | 0.164 | -0.1007 | No | ||
| 11 | PIK3R2 | 18850 | 4208 | 0.163 | -0.1003 | No | ||
| 12 | SHC1 | 9813 9812 5430 | 4421 | 0.139 | -0.1104 | No | ||
| 13 | STAT5A | 20664 | 4510 | 0.131 | -0.1138 | No | ||
| 14 | SHB | 10493 | 4664 | 0.118 | -0.1209 | No | ||
| 15 | INSL3 | 9181 | 5980 | 0.057 | -0.1912 | No | ||
| 16 | ITM2B | 9192 4935 21753 | 7004 | 0.035 | -0.2460 | No | ||
| 17 | PLCB1 | 14832 2821 | 7048 | 0.034 | -0.2480 | No | ||
| 18 | FRAP1 | 2468 15991 | 7735 | 0.023 | -0.2847 | No | ||
| 19 | LYN | 16281 | 9750 | -0.003 | -0.3932 | No | ||
| 20 | STAT5B | 20222 | 10037 | -0.007 | -0.4086 | No | ||
| 21 | SOS1 | 5476 | 10751 | -0.016 | -0.4468 | No | ||
| 22 | IRS1 | 4925 | 11570 | -0.028 | -0.4906 | No | ||
| 23 | PIK3R1 | 3170 | 11694 | -0.031 | -0.4970 | No | ||
| 24 | CBL | 19154 | 11843 | -0.033 | -0.5046 | No | ||
| 25 | PTPN11 | 5326 16391 9660 | 12087 | -0.038 | -0.5174 | No | ||
| 26 | IL2 | 15354 | 12608 | -0.050 | -0.5449 | No | ||
| 27 | NGFR | 5174 | 13153 | -0.067 | -0.5735 | No | ||
| 28 | NMI | 14590 | 13334 | -0.073 | -0.5825 | No | ||
| 29 | FOXO3 | 19782 3402 | 13431 | -0.077 | -0.5869 | No | ||
| 30 | CRK | 4559 1249 | 13780 | -0.096 | -0.6048 | No | ||
| 31 | PIK3CA | 9562 | 13936 | -0.107 | -0.6121 | No | ||
| 32 | GAB2 | 1821 18184 2025 | 14159 | -0.123 | -0.6228 | No | ||
| 33 | JAK2 | 23893 9197 3706 | 14343 | -0.140 | -0.6313 | No | ||
| 34 | IL2RG | 24096 | 14951 | -0.226 | -0.6618 | No | ||
| 35 | JAK3 | 9198 4936 | 15055 | -0.249 | -0.6649 | No | ||
| 36 | FYN | 3375 3395 20052 | 15076 | -0.254 | -0.6635 | No | ||
| 37 | RPS6KB1 | 7815 1207 13040 | 15117 | -0.261 | -0.6631 | No | ||
| 38 | SOCS3 | 20131 | 15281 | -0.304 | -0.6689 | No | ||
| 39 | ETS2 | 10716 | 15825 | -0.528 | -0.6930 | No | ||
| 40 | NR3C1 | 9043 | 15913 | -0.586 | -0.6919 | No | ||
| 41 | JAK1 | 15827 | 16111 | -0.760 | -0.6951 | No | ||
| 42 | RAF1 | 17035 | 16625 | -1.259 | -0.7103 | Yes | ||
| 43 | MAPK3 | 6458 11170 | 16645 | -1.295 | -0.6986 | Yes | ||
| 44 | STAM | 2912 15117 | 16814 | -1.529 | -0.6927 | Yes | ||
| 45 | GRB2 | 20149 | 17099 | -1.953 | -0.6888 | Yes | ||
| 46 | ICAM1 | 19545 | 17174 | -2.093 | -0.6723 | Yes | ||
| 47 | CISH | 8743 | 17180 | -2.104 | -0.6519 | Yes | ||
| 48 | SYK | 21636 | 17785 | -3.326 | -0.6518 | Yes | ||
| 49 | RELA | 23783 | 17808 | -3.389 | -0.6197 | Yes | ||
| 50 | CRKL | 4560 | 17866 | -3.568 | -0.5877 | Yes | ||
| 51 | NFKB1 | 15160 | 17907 | -3.696 | -0.5536 | Yes | ||
| 52 | SOCS1 | 4522 | 17909 | -3.698 | -0.5173 | Yes | ||
| 53 | IL2RA | 4918 | 18055 | -4.139 | -0.4845 | Yes | ||
| 54 | CD53 | 4500 | 18252 | -5.142 | -0.4446 | Yes | ||
| 55 | PTK2B | 21776 | 18273 | -5.239 | -0.3942 | Yes | ||
| 56 | STAT1 | 3936 5524 | 18359 | -5.675 | -0.3431 | Yes | ||
| 57 | STAT3 | 5525 9906 | 18377 | -5.818 | -0.2869 | Yes | ||
| 58 | LCK | 15746 | 18405 | -6.029 | -0.2292 | Yes | ||
| 59 | PTPN6 | 17002 | 18509 | -7.257 | -0.1635 | Yes | ||
| 60 | PIK3CG | 6635 | 18554 | -7.967 | -0.0876 | Yes | ||
| 61 | MAPK1 | 1642 11167 | 18603 | -9.259 | 0.0007 | Yes |