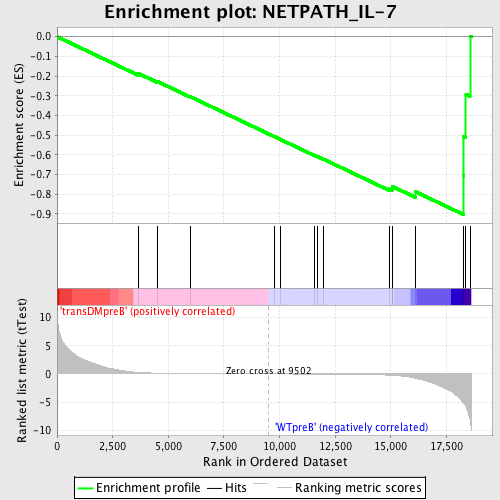
Profile of the Running ES Score & Positions of GeneSet Members on the Rank Ordered List
| Dataset | Set_04_transDMpreB_versus_WTpreB.phenotype_transDMpreB_versus_WTpreB.cls #transDMpreB_versus_WTpreB |
| Phenotype | phenotype_transDMpreB_versus_WTpreB.cls#transDMpreB_versus_WTpreB |
| Upregulated in class | WTpreB |
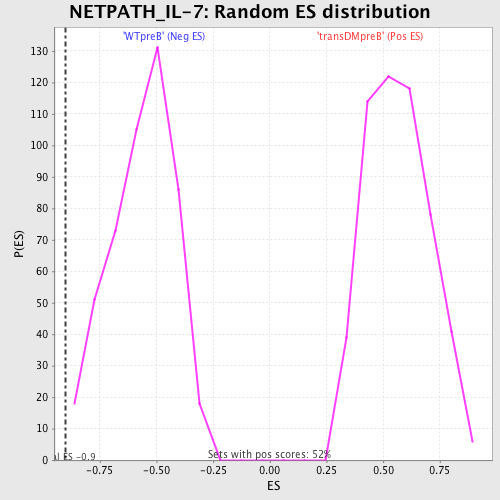
| GeneSet | NETPATH_IL-7 |
| Enrichment Score (ES) | -0.90345776 |
| Normalized Enrichment Score (NES) | -1.6093521 |
| Nominal p-value | 0.002074689 |
| FDR q-value | 0.044156455 |
| FWER p-Value | 0.523 |
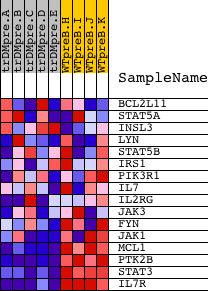
| PROBE | DESCRIPTION (from dataset) | GENE SYMBOL | GENE_TITLE | RANK IN GENE LIST | RANK METRIC SCORE | RUNNING ES | CORE ENRICHMENT | |
|---|---|---|---|---|---|---|---|---|
| 1 | BCL2L11 | 2790 14861 | 3657 | 0.259 | -0.1868 | No | ||
| 2 | STAT5A | 20664 | 4510 | 0.131 | -0.2276 | No | ||
| 3 | INSL3 | 9181 | 5980 | 0.057 | -0.3044 | No | ||
| 4 | LYN | 16281 | 9750 | -0.003 | -0.5069 | No | ||
| 5 | STAT5B | 20222 | 10037 | -0.007 | -0.5220 | No | ||
| 6 | IRS1 | 4925 | 11570 | -0.028 | -0.6033 | No | ||
| 7 | PIK3R1 | 3170 | 11694 | -0.031 | -0.6087 | No | ||
| 8 | IL7 | 4921 | 11984 | -0.036 | -0.6229 | No | ||
| 9 | IL2RG | 24096 | 14951 | -0.226 | -0.7738 | No | ||
| 10 | JAK3 | 9198 4936 | 15055 | -0.249 | -0.7699 | No | ||
| 11 | FYN | 3375 3395 20052 | 15076 | -0.254 | -0.7613 | No | ||
| 12 | JAK1 | 15827 | 16111 | -0.760 | -0.7880 | Yes | ||
| 13 | MCL1 | 15502 | 18260 | -5.175 | -0.7067 | Yes | ||
| 14 | PTK2B | 21776 | 18273 | -5.239 | -0.5081 | Yes | ||
| 15 | STAT3 | 5525 9906 | 18377 | -5.818 | -0.2924 | Yes | ||
| 16 | IL7R | 9175 4922 | 18559 | -8.025 | 0.0031 | Yes |