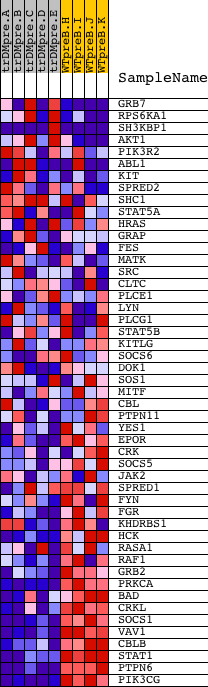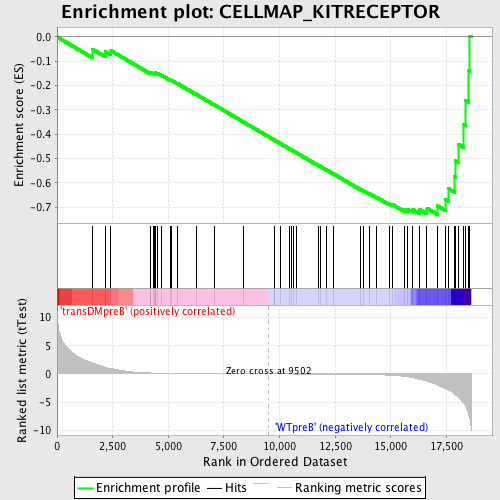
Profile of the Running ES Score & Positions of GeneSet Members on the Rank Ordered List
| Dataset | Set_04_transDMpreB_versus_WTpreB.phenotype_transDMpreB_versus_WTpreB.cls #transDMpreB_versus_WTpreB |
| Phenotype | phenotype_transDMpreB_versus_WTpreB.cls#transDMpreB_versus_WTpreB |
| Upregulated in class | WTpreB |
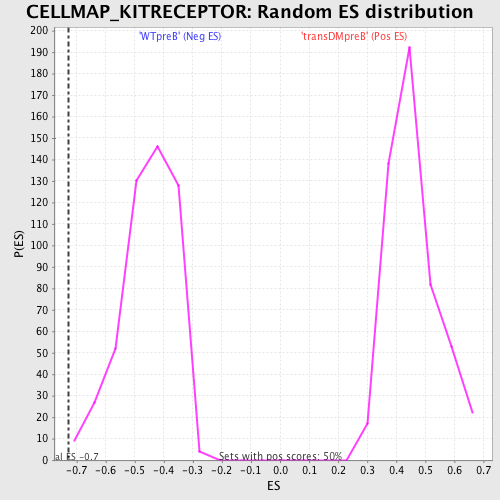
| GeneSet | CELLMAP_KITRECEPTOR |
| Enrichment Score (ES) | -0.7296939 |
| Normalized Enrichment Score (NES) | -1.6157898 |
| Nominal p-value | 0.002016129 |
| FDR q-value | 0.043710157 |
| FWER p-Value | 0.472 |
| PROBE | DESCRIPTION (from dataset) | GENE SYMBOL | GENE_TITLE | RANK IN GENE LIST | RANK METRIC SCORE | RUNNING ES | CORE ENRICHMENT | |
|---|---|---|---|---|---|---|---|---|
| 1 | GRB7 | 20673 | 1581 | 1.934 | -0.0503 | No | ||
| 2 | RPS6KA1 | 15725 | 2164 | 1.195 | -0.0601 | No | ||
| 3 | SH3KBP1 | 2631 12206 7189 | 2421 | 0.965 | -0.0565 | No | ||
| 4 | AKT1 | 8568 | 4184 | 0.164 | -0.1484 | No | ||
| 5 | PIK3R2 | 18850 | 4208 | 0.163 | -0.1467 | No | ||
| 6 | ABL1 | 2693 4301 2794 | 4314 | 0.151 | -0.1496 | No | ||
| 7 | KIT | 16823 | 4387 | 0.142 | -0.1509 | No | ||
| 8 | SPRED2 | 8539 4332 | 4420 | 0.139 | -0.1501 | No | ||
| 9 | SHC1 | 9813 9812 5430 | 4421 | 0.139 | -0.1476 | No | ||
| 10 | STAT5A | 20664 | 4510 | 0.131 | -0.1500 | No | ||
| 11 | HRAS | 4868 | 4707 | 0.115 | -0.1585 | No | ||
| 12 | GRAP | 20851 | 5104 | 0.090 | -0.1782 | No | ||
| 13 | FES | 17779 3949 | 5137 | 0.089 | -0.1783 | No | ||
| 14 | MATK | 3425 19930 | 5418 | 0.076 | -0.1920 | No | ||
| 15 | SRC | 5507 | 6271 | 0.049 | -0.2370 | No | ||
| 16 | CLTC | 14610 | 7073 | 0.033 | -0.2796 | No | ||
| 17 | PLCE1 | 13156 | 8376 | 0.014 | -0.3494 | No | ||
| 18 | LYN | 16281 | 9750 | -0.003 | -0.4233 | No | ||
| 19 | PLCG1 | 14753 | 9775 | -0.004 | -0.4245 | No | ||
| 20 | STAT5B | 20222 | 10037 | -0.007 | -0.4385 | No | ||
| 21 | KITLG | 19889 3342 | 10459 | -0.012 | -0.4609 | No | ||
| 22 | SOCS6 | 12042 7044 | 10556 | -0.014 | -0.4658 | No | ||
| 23 | DOK1 | 17104 1018 1177 | 10626 | -0.015 | -0.4693 | No | ||
| 24 | SOS1 | 5476 | 10751 | -0.016 | -0.4757 | No | ||
| 25 | MITF | 17349 | 11768 | -0.032 | -0.5298 | No | ||
| 26 | CBL | 19154 | 11843 | -0.033 | -0.5332 | No | ||
| 27 | PTPN11 | 5326 16391 9660 | 12087 | -0.038 | -0.5456 | No | ||
| 28 | YES1 | 5930 | 12441 | -0.046 | -0.5638 | No | ||
| 29 | EPOR | 19204 | 13643 | -0.088 | -0.6269 | No | ||
| 30 | CRK | 4559 1249 | 13780 | -0.096 | -0.6325 | No | ||
| 31 | SOCS5 | 1619 23141 | 14043 | -0.114 | -0.6445 | No | ||
| 32 | JAK2 | 23893 9197 3706 | 14343 | -0.140 | -0.6581 | No | ||
| 33 | SPRED1 | 4331 | 14947 | -0.225 | -0.6865 | No | ||
| 34 | FYN | 3375 3395 20052 | 15076 | -0.254 | -0.6888 | No | ||
| 35 | FGR | 4723 | 15626 | -0.432 | -0.7106 | Yes | ||
| 36 | KHDRBS1 | 5405 9778 | 15739 | -0.484 | -0.7079 | Yes | ||
| 37 | HCK | 14787 | 15955 | -0.616 | -0.7084 | Yes | ||
| 38 | RASA1 | 10174 | 16303 | -0.967 | -0.7096 | Yes | ||
| 39 | RAF1 | 17035 | 16625 | -1.259 | -0.7042 | Yes | ||
| 40 | GRB2 | 20149 | 17099 | -1.953 | -0.6945 | Yes | ||
| 41 | PRKCA | 20174 | 17460 | -2.570 | -0.6675 | Yes | ||
| 42 | BAD | 24000 | 17607 | -2.854 | -0.6239 | Yes | ||
| 43 | CRKL | 4560 | 17866 | -3.568 | -0.5735 | Yes | ||
| 44 | SOCS1 | 4522 | 17909 | -3.698 | -0.5091 | Yes | ||
| 45 | VAV1 | 23173 | 18053 | -4.129 | -0.4423 | Yes | ||
| 46 | CBLB | 5531 22734 | 18286 | -5.302 | -0.3592 | Yes | ||
| 47 | STAT1 | 3936 5524 | 18359 | -5.675 | -0.2608 | Yes | ||
| 48 | PTPN6 | 17002 | 18509 | -7.257 | -0.1379 | Yes | ||
| 49 | PIK3CG | 6635 | 18554 | -7.967 | 0.0033 | Yes |