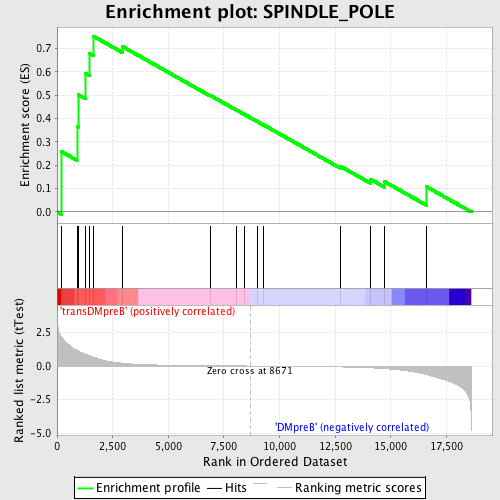
Profile of the Running ES Score & Positions of GeneSet Members on the Rank Ordered List
| Dataset | Set_04_transDMpreB_versus_DMpreB.phenotype_transDMpreB_versus_DMpreB.cls #transDMpreB_versus_DMpreB.phenotype_transDMpreB_versus_DMpreB.cls #transDMpreB_versus_DMpreB_repos |
| Phenotype | phenotype_transDMpreB_versus_DMpreB.cls#transDMpreB_versus_DMpreB_repos |
| Upregulated in class | transDMpreB |
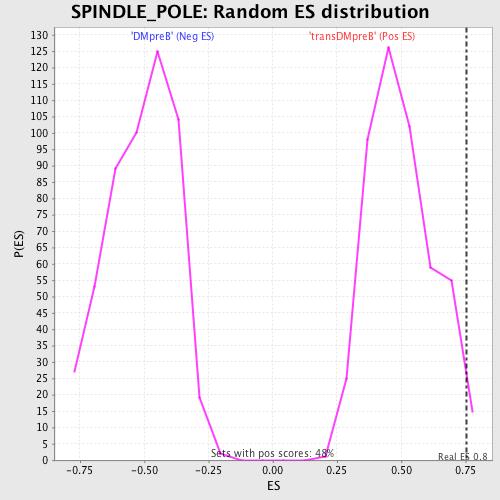
| GeneSet | SPINDLE_POLE |
| Enrichment Score (ES) | 0.75258076 |
| Normalized Enrichment Score (NES) | 1.5076028 |
| Nominal p-value | 0.02079002 |
| FDR q-value | 1.0 |
| FWER p-Value | 1.0 |
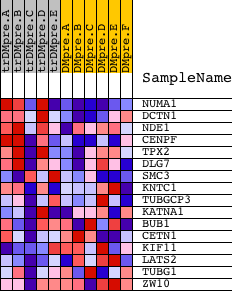
| PROBE | DESCRIPTION (from dataset) | GENE SYMBOL | GENE_TITLE | RANK IN GENE LIST | RANK METRIC SCORE | RUNNING ES | CORE ENRICHMENT | |
|---|---|---|---|---|---|---|---|---|
| 1 | NUMA1 | 18167 | 200 | 2.156 | 0.2580 | Yes | ||
| 2 | DCTN1 | 1100 17392 | 895 | 1.166 | 0.3660 | Yes | ||
| 3 | NDE1 | 7405 1759 | 944 | 1.112 | 0.5020 | Yes | ||
| 4 | CENPF | 13723 | 1287 | 0.866 | 0.5916 | Yes | ||
| 5 | TPX2 | 14790 | 1448 | 0.770 | 0.6791 | Yes | ||
| 6 | DLG7 | 21858 | 1625 | 0.665 | 0.7526 | Yes | ||
| 7 | SMC3 | 8811 23815 8812 4571 | 2932 | 0.210 | 0.7085 | No | ||
| 8 | KNTC1 | 16705 | 6876 | 0.022 | 0.4992 | No | ||
| 9 | TUBGCP3 | 18933 | 8065 | 0.007 | 0.4362 | No | ||
| 10 | KATNA1 | 20093 | 8427 | 0.003 | 0.4172 | No | ||
| 11 | BUB1 | 8665 | 9007 | -0.004 | 0.3865 | No | ||
| 12 | CETN1 | 6443 | 9284 | -0.008 | 0.3726 | No | ||
| 13 | KIF11 | 23873 | 12720 | -0.068 | 0.1965 | No | ||
| 14 | LATS2 | 11923 6928 | 14097 | -0.134 | 0.1391 | No | ||
| 15 | TUBG1 | 20662 | 14727 | -0.193 | 0.1294 | No | ||
| 16 | ZW10 | 3114 19464 | 16618 | -0.639 | 0.1074 | No |