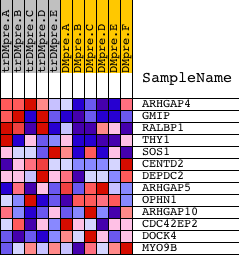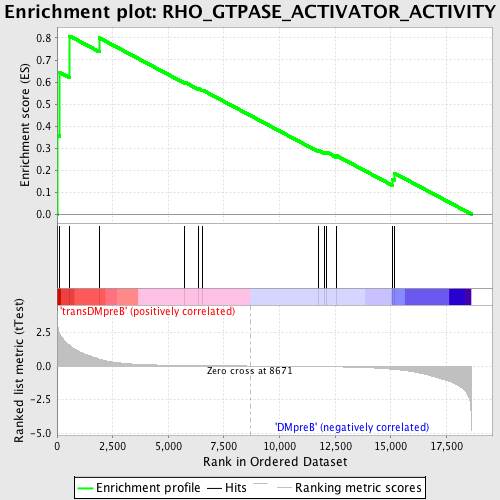
Profile of the Running ES Score & Positions of GeneSet Members on the Rank Ordered List
| Dataset | Set_04_transDMpreB_versus_DMpreB.phenotype_transDMpreB_versus_DMpreB.cls #transDMpreB_versus_DMpreB.phenotype_transDMpreB_versus_DMpreB.cls #transDMpreB_versus_DMpreB_repos |
| Phenotype | phenotype_transDMpreB_versus_DMpreB.cls#transDMpreB_versus_DMpreB_repos |
| Upregulated in class | transDMpreB |
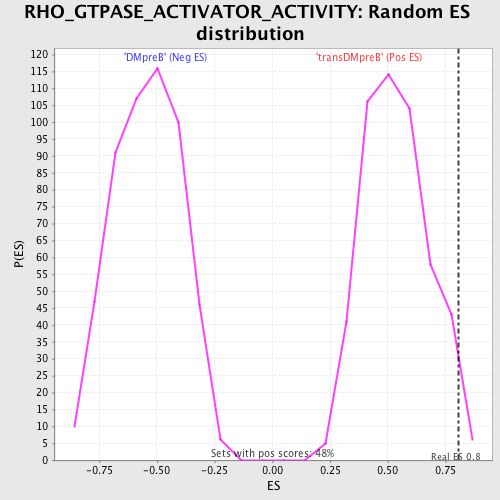
| GeneSet | RHO_GTPASE_ACTIVATOR_ACTIVITY |
| Enrichment Score (ES) | 0.8085064 |
| Normalized Enrichment Score (NES) | 1.5091754 |
| Nominal p-value | 0.016771488 |
| FDR q-value | 1.0 |
| FWER p-Value | 1.0 |
| PROBE | DESCRIPTION (from dataset) | GENE SYMBOL | GENE_TITLE | RANK IN GENE LIST | RANK METRIC SCORE | RUNNING ES | CORE ENRICHMENT | |
|---|---|---|---|---|---|---|---|---|
| 1 | ARHGAP4 | 9343 | 35 | 2.919 | 0.3586 | Yes | ||
| 2 | GMIP | 18597 | 124 | 2.341 | 0.6429 | Yes | ||
| 3 | RALBP1 | 9725 | 569 | 1.534 | 0.8085 | Yes | ||
| 4 | THY1 | 19481 | 1891 | 0.512 | 0.8007 | No | ||
| 5 | SOS1 | 5476 | 5727 | 0.041 | 0.5997 | No | ||
| 6 | CENTD2 | 1758 18169 2284 | 6373 | 0.030 | 0.5687 | No | ||
| 7 | DEPDC2 | 14295 | 6543 | 0.027 | 0.5629 | No | ||
| 8 | ARHGAP5 | 4412 8625 | 11744 | -0.044 | 0.2888 | No | ||
| 9 | OPHN1 | 24102 | 12002 | -0.049 | 0.2810 | No | ||
| 10 | ARHGAP10 | 3808 18836 | 12109 | -0.051 | 0.2817 | No | ||
| 11 | CDC42EP2 | 4180 14771 | 12539 | -0.063 | 0.2664 | No | ||
| 12 | DOCK4 | 10705 | 15079 | -0.237 | 0.1592 | No | ||
| 13 | MYO9B | 5142 18581 | 15165 | -0.250 | 0.1855 | No |