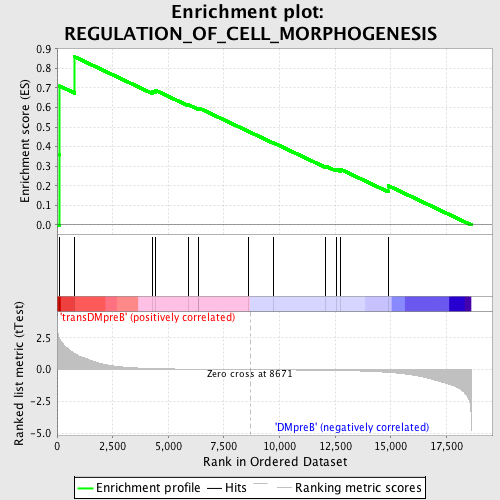
Profile of the Running ES Score & Positions of GeneSet Members on the Rank Ordered List
| Dataset | Set_04_transDMpreB_versus_DMpreB.phenotype_transDMpreB_versus_DMpreB.cls #transDMpreB_versus_DMpreB.phenotype_transDMpreB_versus_DMpreB.cls #transDMpreB_versus_DMpreB_repos |
| Phenotype | phenotype_transDMpreB_versus_DMpreB.cls#transDMpreB_versus_DMpreB_repos |
| Upregulated in class | transDMpreB |
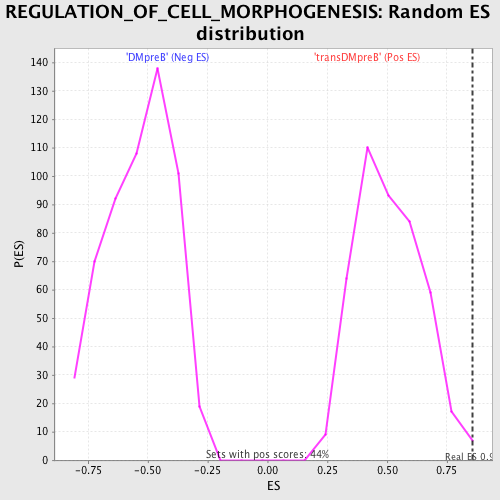
| GeneSet | REGULATION_OF_CELL_MORPHOGENESIS |
| Enrichment Score (ES) | 0.8590835 |
| Normalized Enrichment Score (NES) | 1.6895872 |
| Nominal p-value | 0.006772009 |
| FDR q-value | 0.33091927 |
| FWER p-Value | 0.495 |
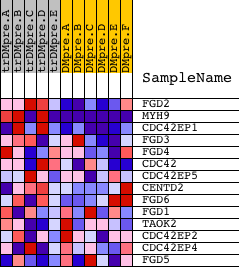
| PROBE | DESCRIPTION (from dataset) | GENE SYMBOL | GENE_TITLE | RANK IN GENE LIST | RANK METRIC SCORE | RUNNING ES | CORE ENRICHMENT | |
|---|---|---|---|---|---|---|---|---|
| 1 | FGD2 | 23309 | 94 | 2.487 | 0.3583 | Yes | ||
| 2 | MYH9 | 2252 2244 | 109 | 2.414 | 0.7103 | Yes | ||
| 3 | CDC42EP1 | 22433 10435 13411 11239 | 790 | 1.268 | 0.8591 | Yes | ||
| 4 | FGD3 | 11399 | 4280 | 0.085 | 0.6840 | No | ||
| 5 | FGD4 | 10306 5870 1717 1669 1700 | 4414 | 0.080 | 0.6885 | No | ||
| 6 | CDC42 | 4503 8722 4504 2465 | 5895 | 0.038 | 0.6145 | No | ||
| 7 | CDC42EP5 | 17991 | 6342 | 0.030 | 0.5949 | No | ||
| 8 | CENTD2 | 1758 18169 2284 | 6373 | 0.030 | 0.5977 | No | ||
| 9 | FGD6 | 19901 | 8581 | 0.001 | 0.4792 | No | ||
| 10 | FGD1 | 24228 | 9726 | -0.013 | 0.4196 | No | ||
| 11 | TAOK2 | 10610 3794 | 12072 | -0.051 | 0.3010 | No | ||
| 12 | CDC42EP2 | 4180 14771 | 12539 | -0.063 | 0.2851 | No | ||
| 13 | CDC42EP4 | 20163 | 12734 | -0.069 | 0.2847 | No | ||
| 14 | FGD5 | 10555 17352 | 14894 | -0.215 | 0.2001 | No |