Profile of the Running ES Score & Positions of GeneSet Members on the Rank Ordered List
| Dataset | Set_04_transDMpreB_versus_DMpreB.phenotype_transDMpreB_versus_DMpreB.cls #transDMpreB_versus_DMpreB.phenotype_transDMpreB_versus_DMpreB.cls #transDMpreB_versus_DMpreB_repos |
| Phenotype | phenotype_transDMpreB_versus_DMpreB.cls#transDMpreB_versus_DMpreB_repos |
| Upregulated in class | transDMpreB |
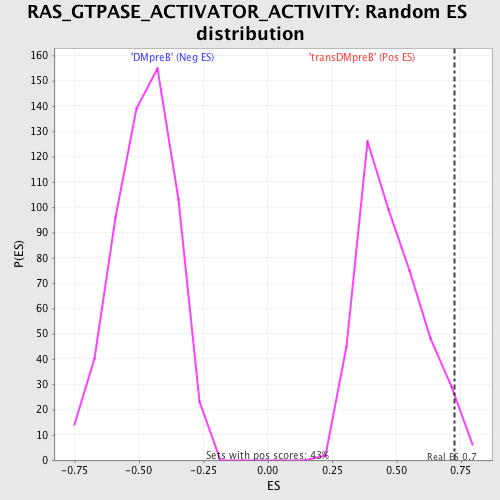
| GeneSet | RAS_GTPASE_ACTIVATOR_ACTIVITY |
| Enrichment Score (ES) | 0.72520554 |
| Normalized Enrichment Score (NES) | 1.5096182 |
| Nominal p-value | 0.037209302 |
| FDR q-value | 1.0 |
| FWER p-Value | 1.0 |
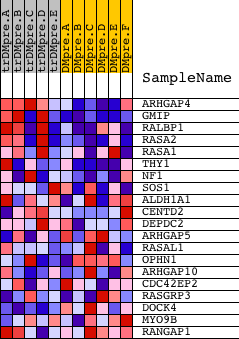
| PROBE | DESCRIPTION (from dataset) | GENE SYMBOL | GENE_TITLE | RANK IN GENE LIST | RANK METRIC SCORE | RUNNING ES | CORE ENRICHMENT | |
|---|---|---|---|---|---|---|---|---|
| 1 | ARHGAP4 | 9343 | 35 | 2.919 | 0.2497 | Yes | ||
| 2 | GMIP | 18597 | 124 | 2.341 | 0.4468 | Yes | ||
| 3 | RALBP1 | 9725 | 569 | 1.534 | 0.5551 | Yes | ||
| 4 | RASA2 | 4329 | 608 | 1.476 | 0.6803 | Yes | ||
| 5 | RASA1 | 10174 | 1390 | 0.808 | 0.7080 | Yes | ||
| 6 | THY1 | 19481 | 1891 | 0.512 | 0.7252 | Yes | ||
| 7 | NF1 | 5165 | 3253 | 0.164 | 0.6662 | No | ||
| 8 | SOS1 | 5476 | 5727 | 0.041 | 0.5368 | No | ||
| 9 | ALDH1A1 | 8569 | 6305 | 0.031 | 0.5084 | No | ||
| 10 | CENTD2 | 1758 18169 2284 | 6373 | 0.030 | 0.5074 | No | ||
| 11 | DEPDC2 | 14295 | 6543 | 0.027 | 0.5006 | No | ||
| 12 | ARHGAP5 | 4412 8625 | 11744 | -0.044 | 0.2247 | No | ||
| 13 | RASAL1 | 16719 | 11804 | -0.045 | 0.2254 | No | ||
| 14 | OPHN1 | 24102 | 12002 | -0.049 | 0.2191 | No | ||
| 15 | ARHGAP10 | 3808 18836 | 12109 | -0.051 | 0.2178 | No | ||
| 16 | CDC42EP2 | 4180 14771 | 12539 | -0.063 | 0.2001 | No | ||
| 17 | RASGRP3 | 10767 | 14421 | -0.162 | 0.1130 | No | ||
| 18 | DOCK4 | 10705 | 15079 | -0.237 | 0.0981 | No | ||
| 19 | MYO9B | 5142 18581 | 15165 | -0.250 | 0.1151 | No | ||
| 20 | RANGAP1 | 2180 22195 | 16983 | -0.817 | 0.0878 | No |