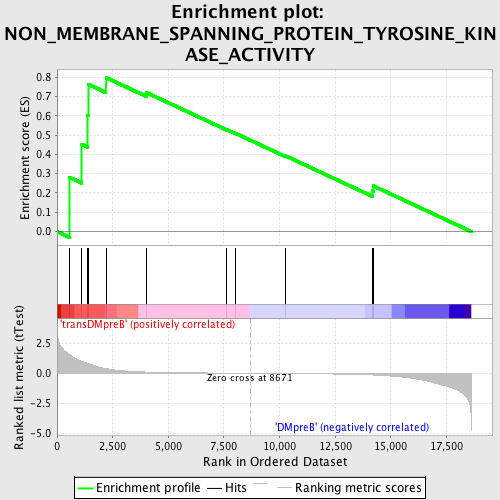
Profile of the Running ES Score & Positions of GeneSet Members on the Rank Ordered List
| Dataset | Set_04_transDMpreB_versus_DMpreB.phenotype_transDMpreB_versus_DMpreB.cls #transDMpreB_versus_DMpreB.phenotype_transDMpreB_versus_DMpreB.cls #transDMpreB_versus_DMpreB_repos |
| Phenotype | phenotype_transDMpreB_versus_DMpreB.cls#transDMpreB_versus_DMpreB_repos |
| Upregulated in class | transDMpreB |
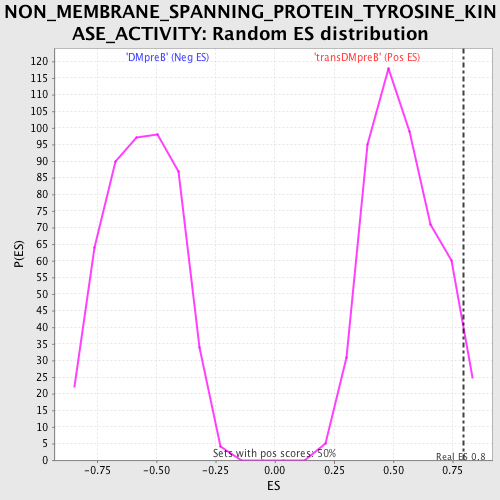
| GeneSet | NON_MEMBRANE_SPANNING_PROTEIN_TYROSINE_KINASE_ACTIVITY |
| Enrichment Score (ES) | 0.7974543 |
| Normalized Enrichment Score (NES) | 1.4811196 |
| Nominal p-value | 0.041666668 |
| FDR q-value | 0.75417626 |
| FWER p-Value | 1.0 |
| PROBE | DESCRIPTION (from dataset) | GENE SYMBOL | GENE_TITLE | RANK IN GENE LIST | RANK METRIC SCORE | RUNNING ES | CORE ENRICHMENT | |
|---|---|---|---|---|---|---|---|---|
| 1 | TYK2 | 12058 19215 | 563 | 1.543 | 0.2808 | Yes | ||
| 2 | DYRK1A | 4649 | 1113 | 0.993 | 0.4514 | Yes | ||
| 3 | TNK2 | 22784 | 1375 | 0.816 | 0.6018 | Yes | ||
| 4 | TEC | 16514 | 1394 | 0.805 | 0.7630 | Yes | ||
| 5 | PTK2B | 21776 | 2197 | 0.385 | 0.7975 | Yes | ||
| 6 | TXK | 16513 | 4030 | 0.100 | 0.7191 | No | ||
| 7 | FRK | 20056 | 7633 | 0.012 | 0.5280 | No | ||
| 8 | ITK | 4934 | 8021 | 0.007 | 0.5087 | No | ||
| 9 | PTK6 | 14308 | 10273 | -0.020 | 0.3918 | No | ||
| 10 | CLK1 | 13951 4127 4529 8748 | 14160 | -0.138 | 0.2108 | No | ||
| 11 | ERBB2 | 8913 | 14207 | -0.142 | 0.2370 | No |